bowenliang123/dsh-context
Best DeepSeek Harness plugin for context insight and management, with context dashboard / browser and context command, for context statistics, composition, breakdown, evolution details, understanding how the context is made of, and how it evolves. 一站式 DeepSeek Harness 上下文可视化插件,Context 面板及浏览器与 Context 命令,透视上下文组成、演进、压缩、剪枝等事件与动作。
Listed
239
Usage
Bundle verified
Preview
What it does
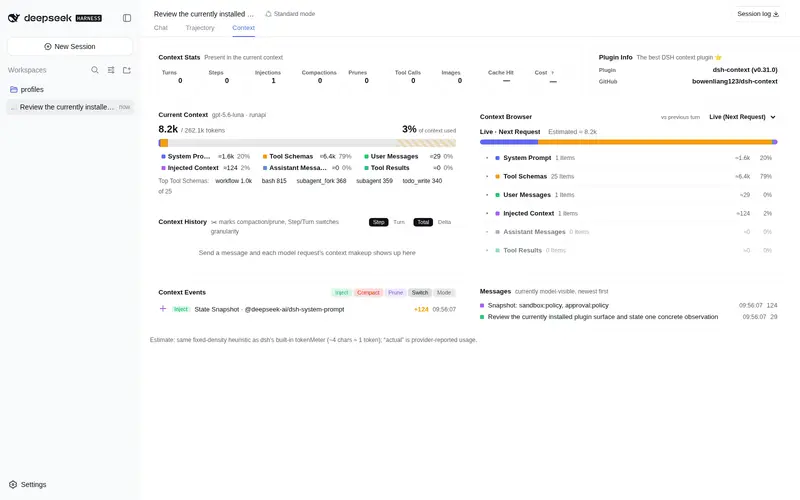
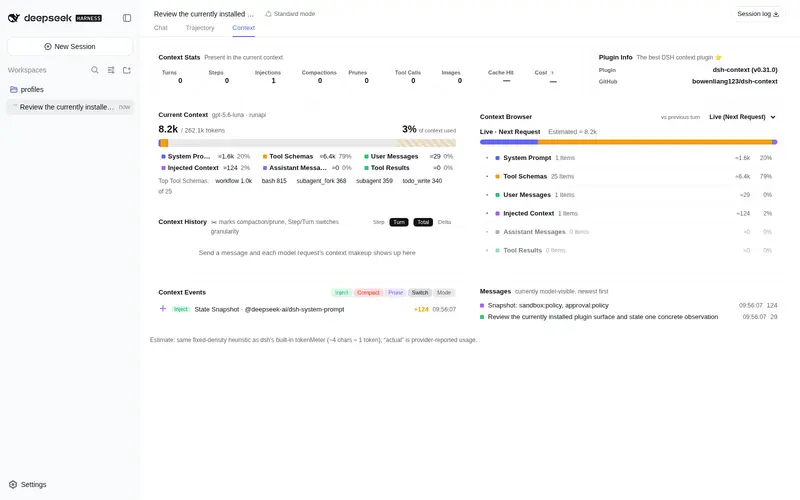
DSH context insight panel: Context dashboard + /context command + Context browser — one-stop context lifecycle management with categorized composition, content details, evolution trends, compaction/injection events, and stats.
Best for
- DSH users diagnosing what consumes a model's context window across system prompts, tools, messages, injections, replies, and results.
- Long-session workflows that need per-request evolution, token estimates, compaction, pruning, injection, and model-switch history.
- Users who want to inspect the assembled content for the live request or retained historical steps from a tab or /context command.
Not ideal for
- Short sessions where context composition and lifecycle events do not need investigation.
- Workflows requiring exact reconstruction of every pre-compaction step; older steps reconstructed from removed-message archives may be approximate.
- Users seeking to change model behavior directly rather than inspect and manage context visibility.
README
dsh-context


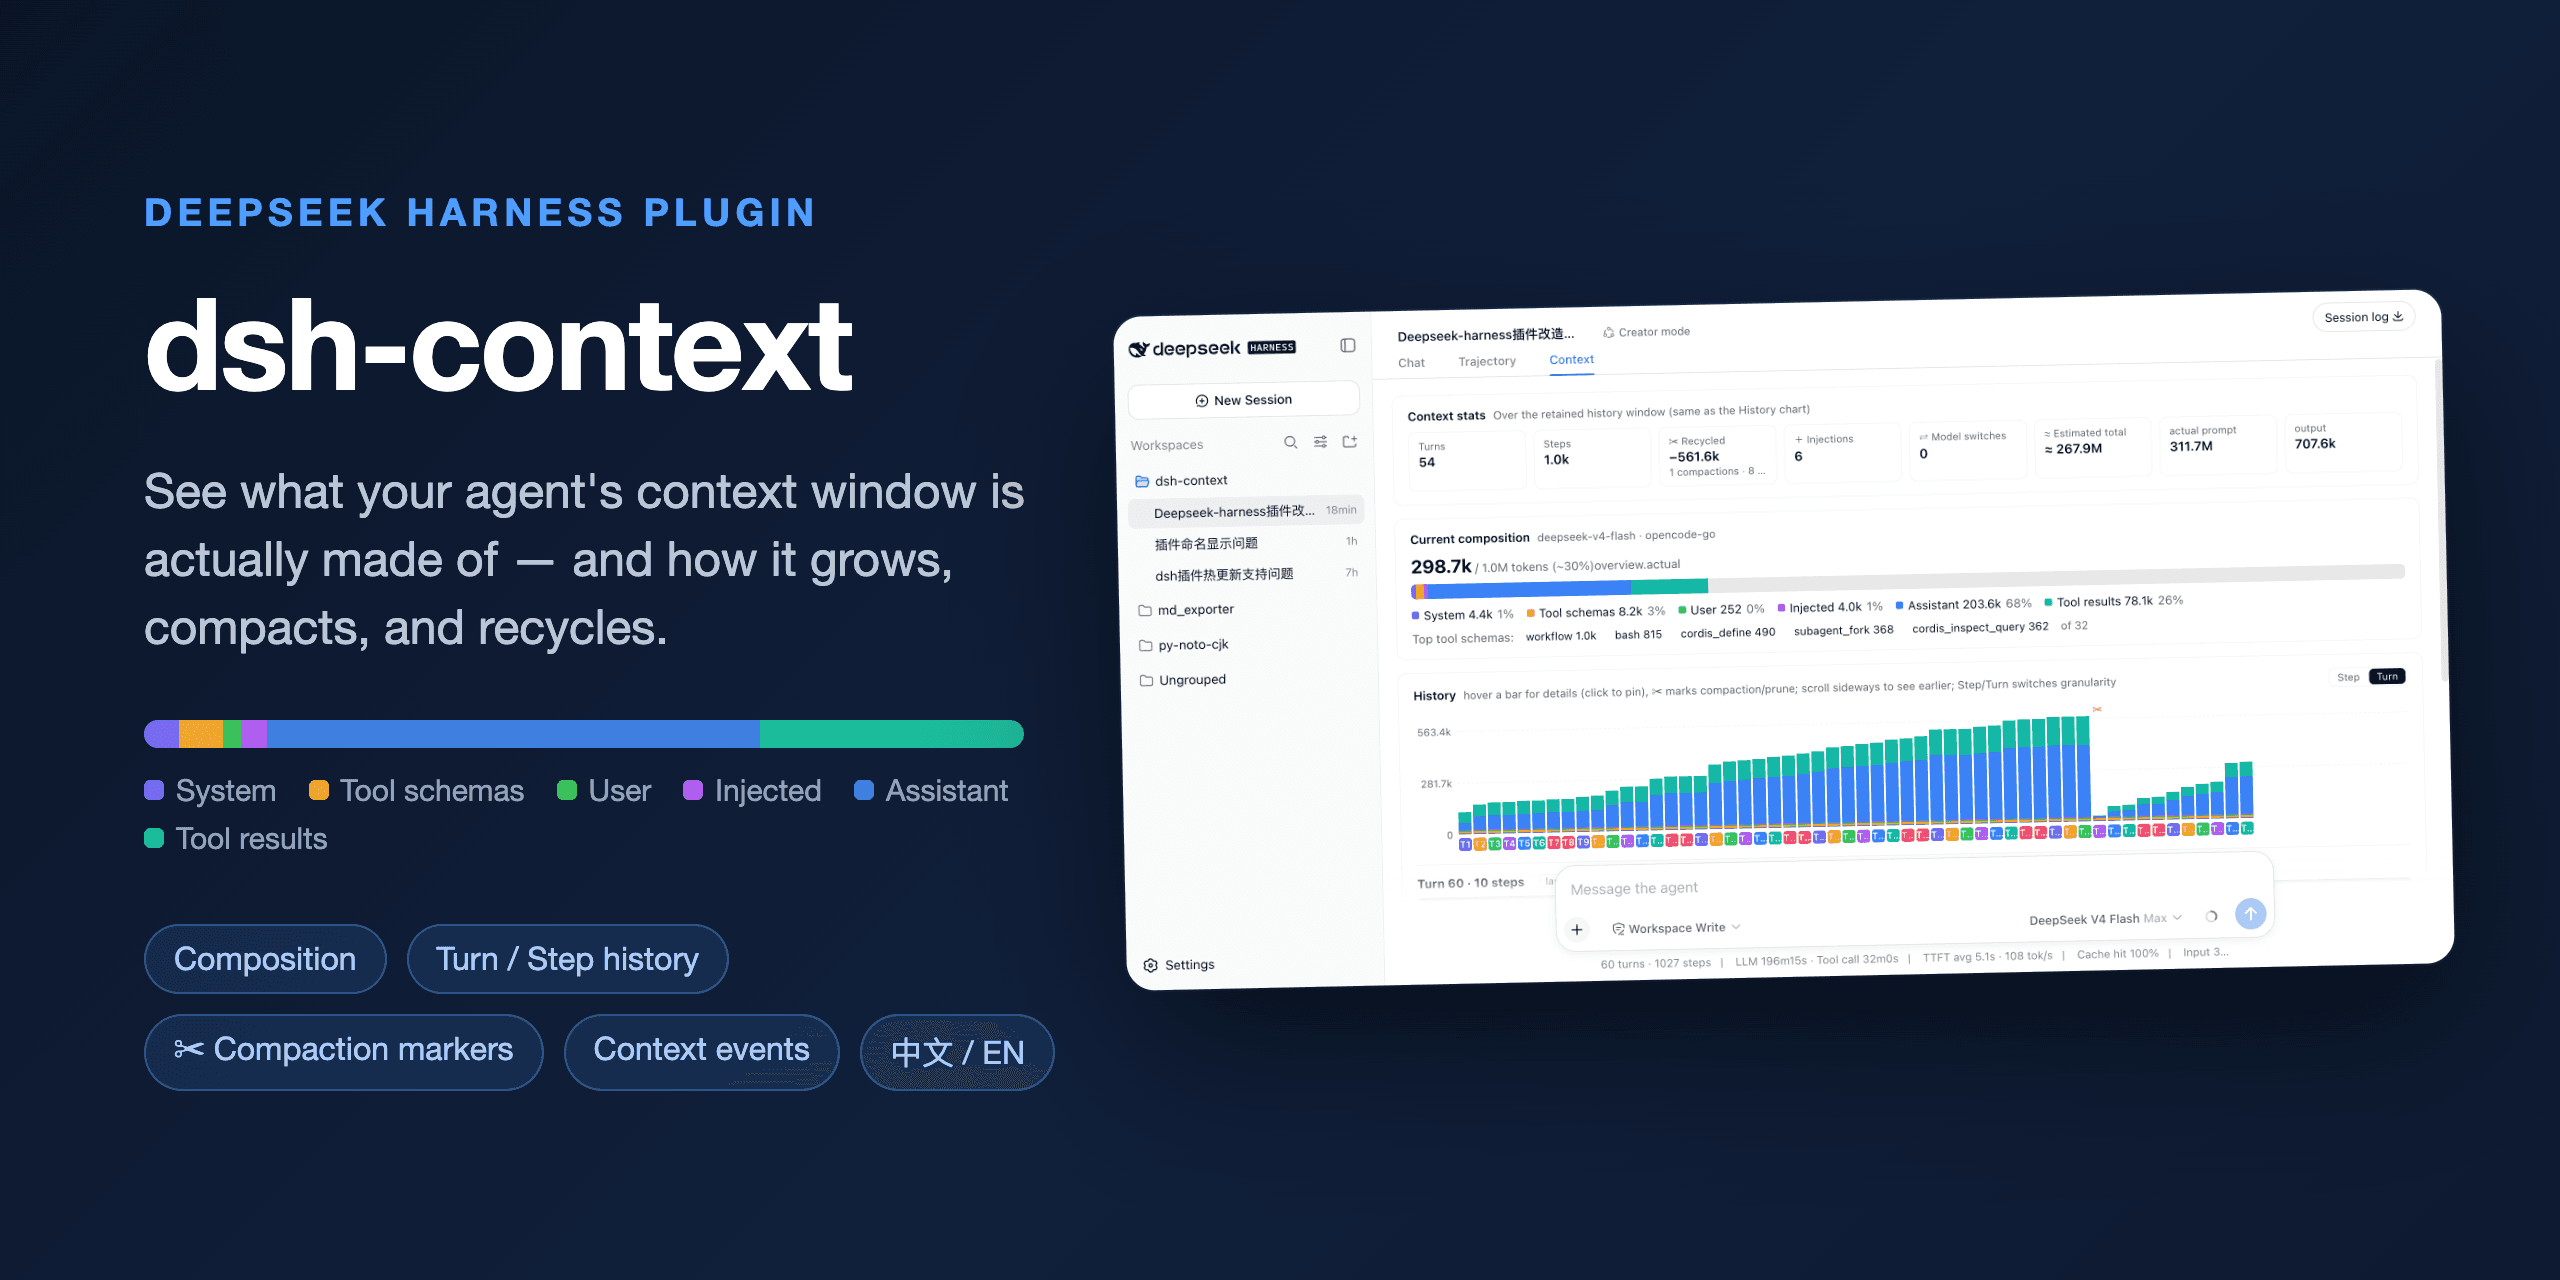
The best DeepSeek Harness plugin for Agent’s context insights and management.
dsh-context provides full context lifecycle management features.
- Context tab — an UI context dashboard for DeepSeek Harness’s context stats, composition, history, events, and messages.
-
/contextcommand — the slash command shows the context model for current context composition and recent context evolution.
Install / Update
To Install from any DeepSeek Harness installation:
dsh plugin --profile web add dsh-context
Or to update the dsh-context plugin:
dsh plugin --profile web update dsh-context@latest
Then start the web UI with dsh web. No build step, no restart.
Use it
Context tab
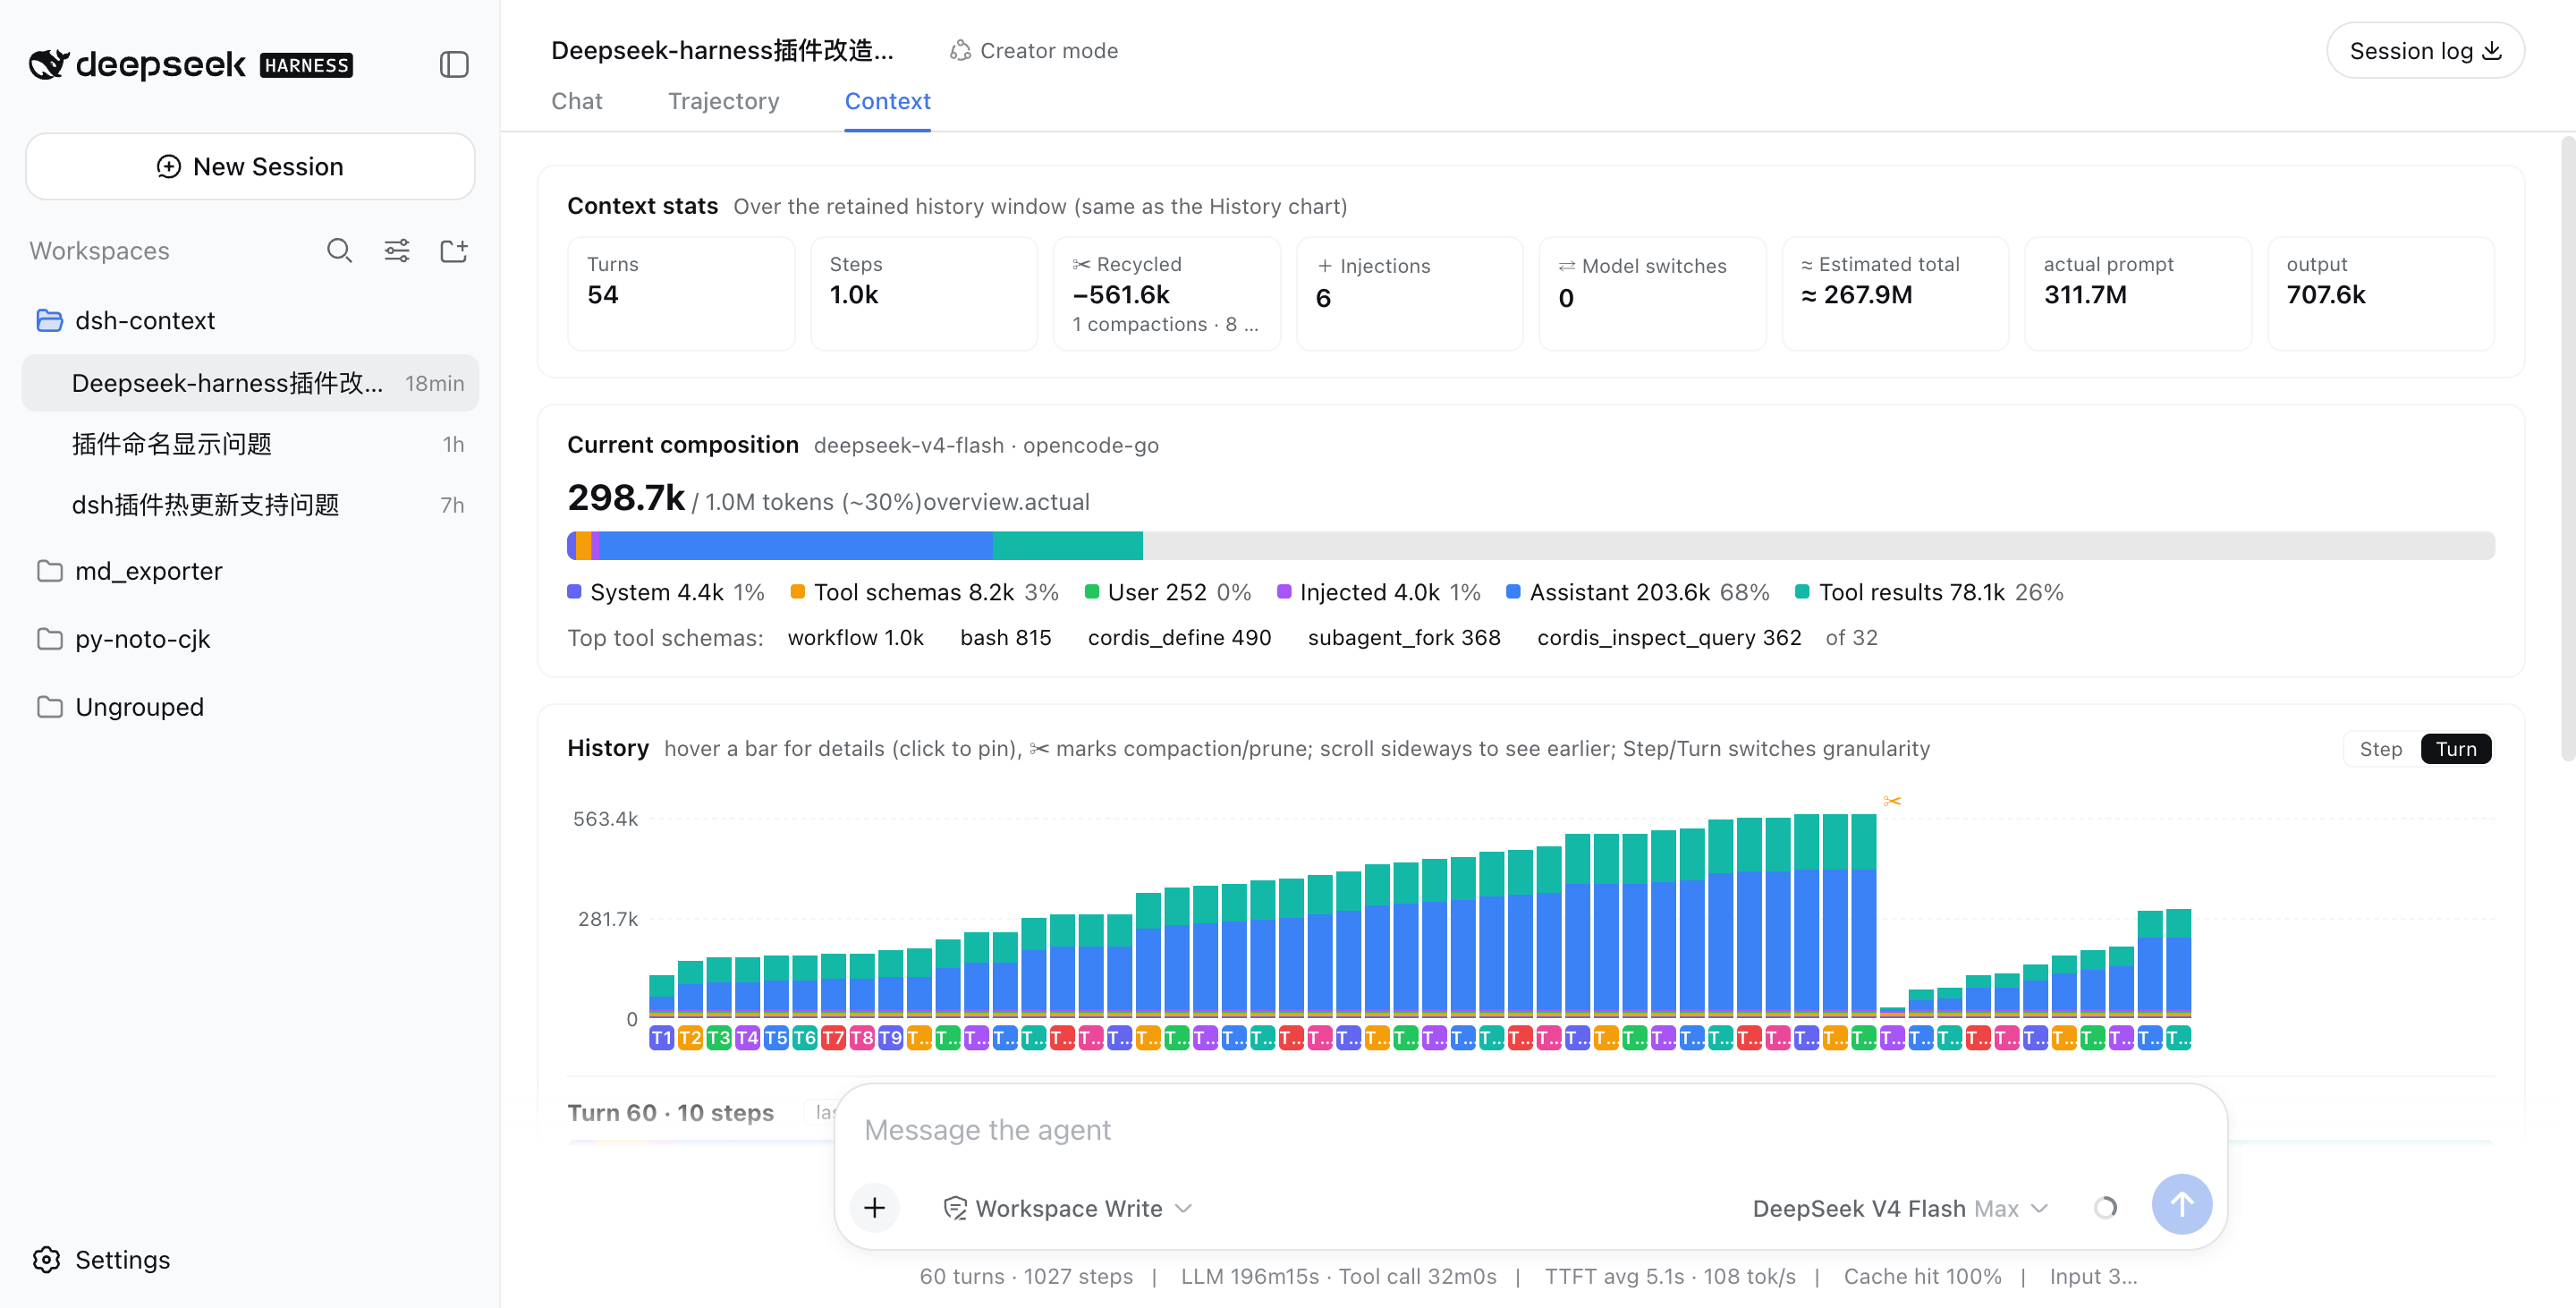
Open any session and click the Context / 上下文 tab:
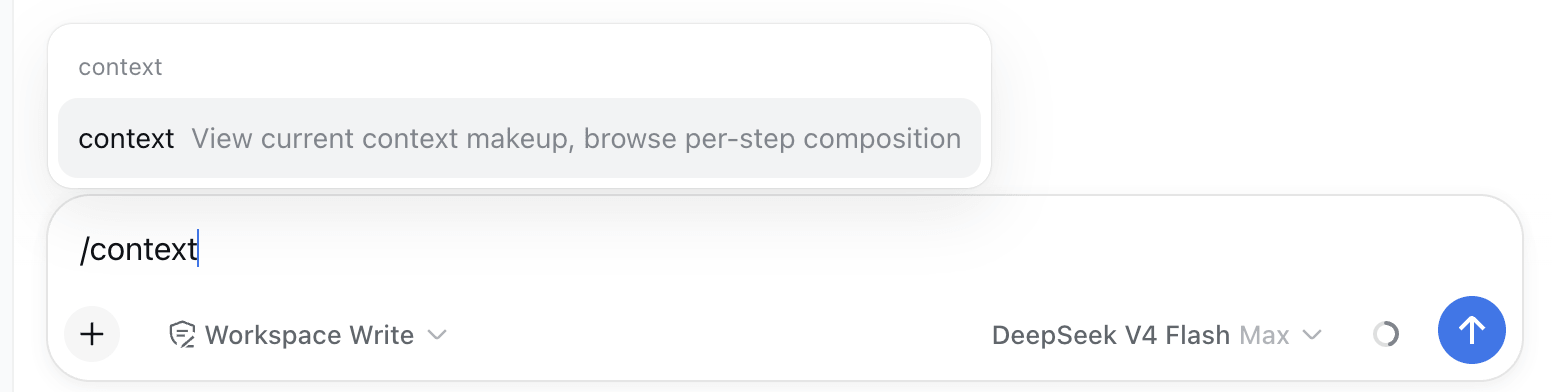
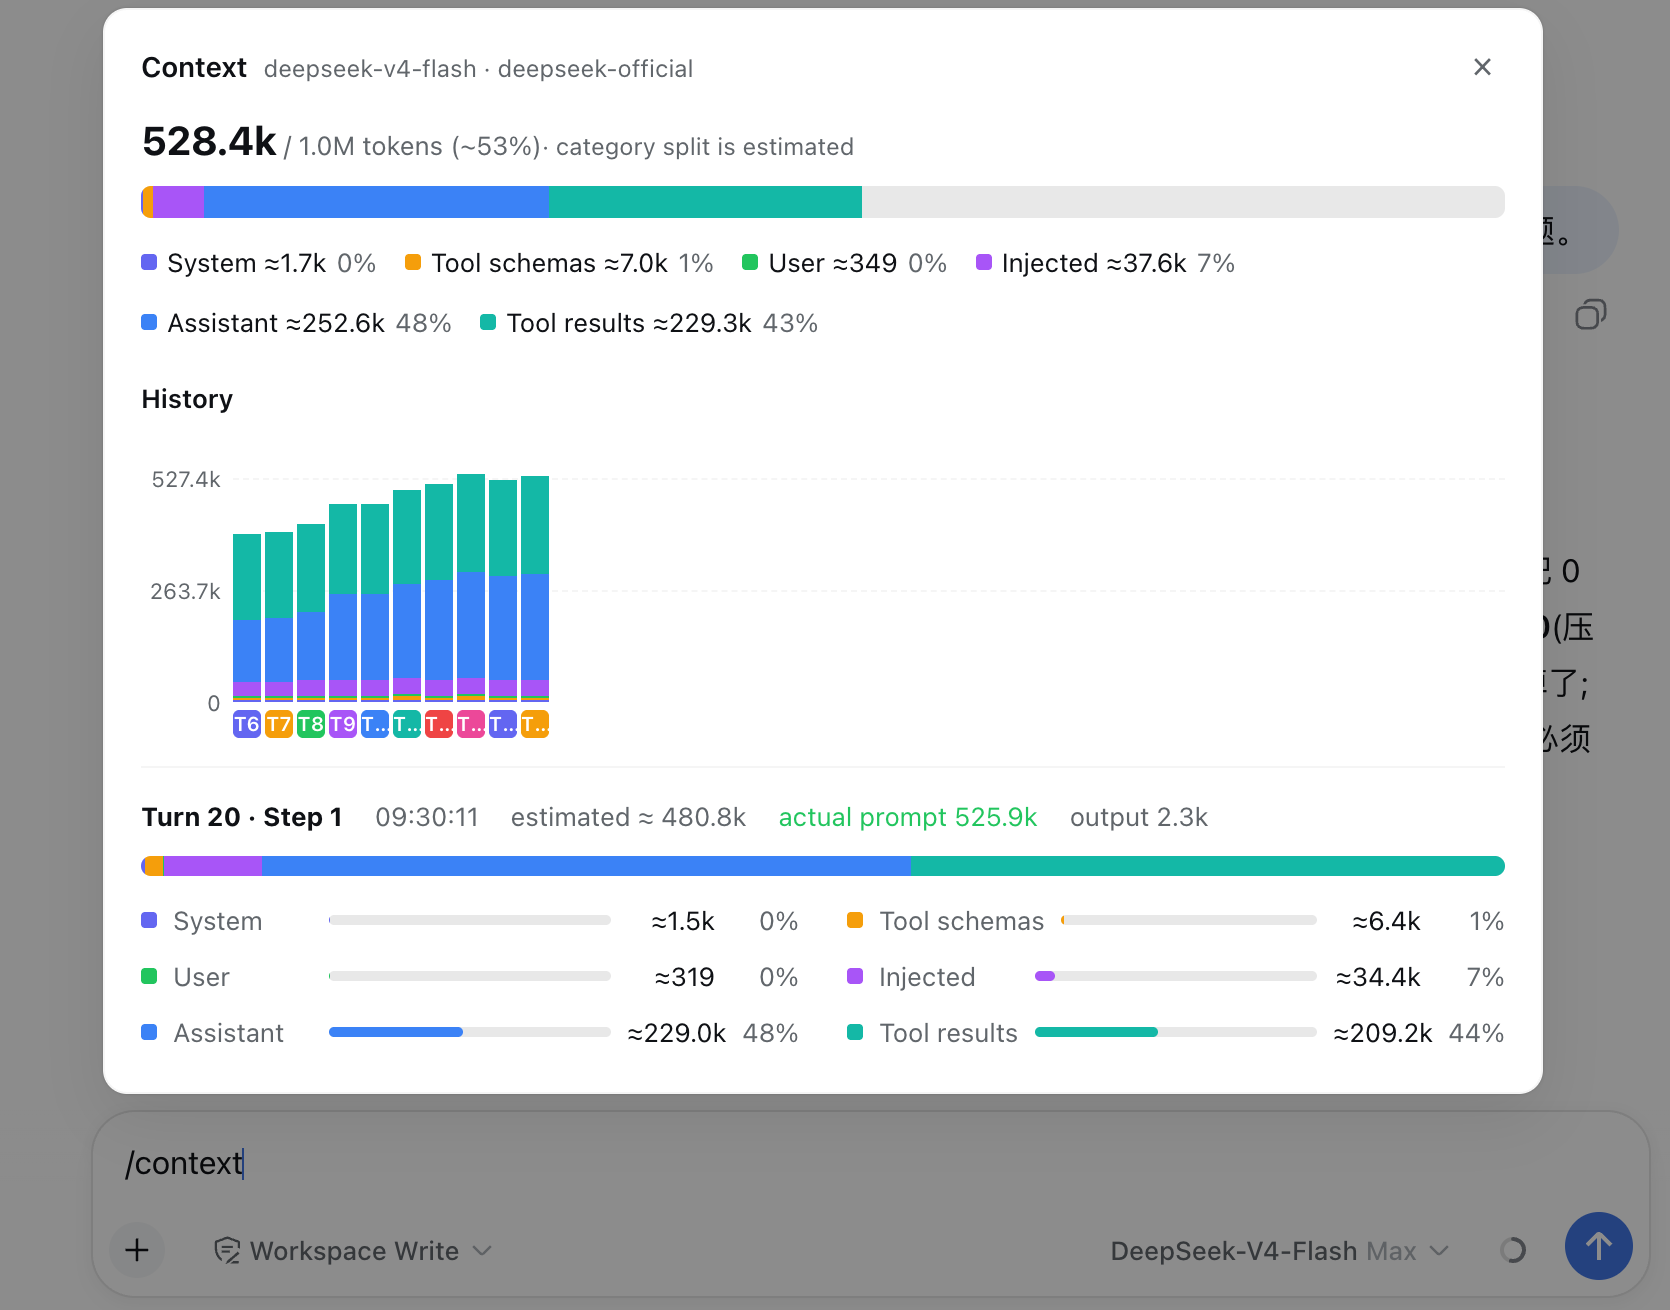
⌨️ /context command — In-session Context Insight modal
Type /context (or pick it from the / menu) and press Enter: a centered dialog shows the Current Composition card and the Context browser — the same composition bar, legend, and per-step browsing as the tab, so you can inspect what any request was assembled from without leaving the chat.
What you’ll see
📊 Context stats — the session at a glance
Turns, steps, how many injections, compactions, and prunes have happened.
🧱 Current composition — what’s in the window right now
A six-color stacked bar scaled against the model’s full context window (the gray track is your remaining headroom): system prompt, tool schemas, your messages, injected context, assistant replies, and tool results — plus the top-5 most expensive tool schemas. When a conversation starts degrading, this is where you find out which part ate the budget.
📈 History — watch the window grow (and get compacted)
One stacked bar per model request, finer than per-message. Toggle between Turn and Step granularity, scroll sideways through the session, hover any bar for a quick tooltip, and click to pin the full breakdown — including provider-reported actual prompt/output tokens next to the estimate. Hovering a bar also drives the Context browser beside it — the browser previews that step’s assembled context in real time as you scrub across the history. ✂ marks where compaction or pruning happened — watch the bars drop:
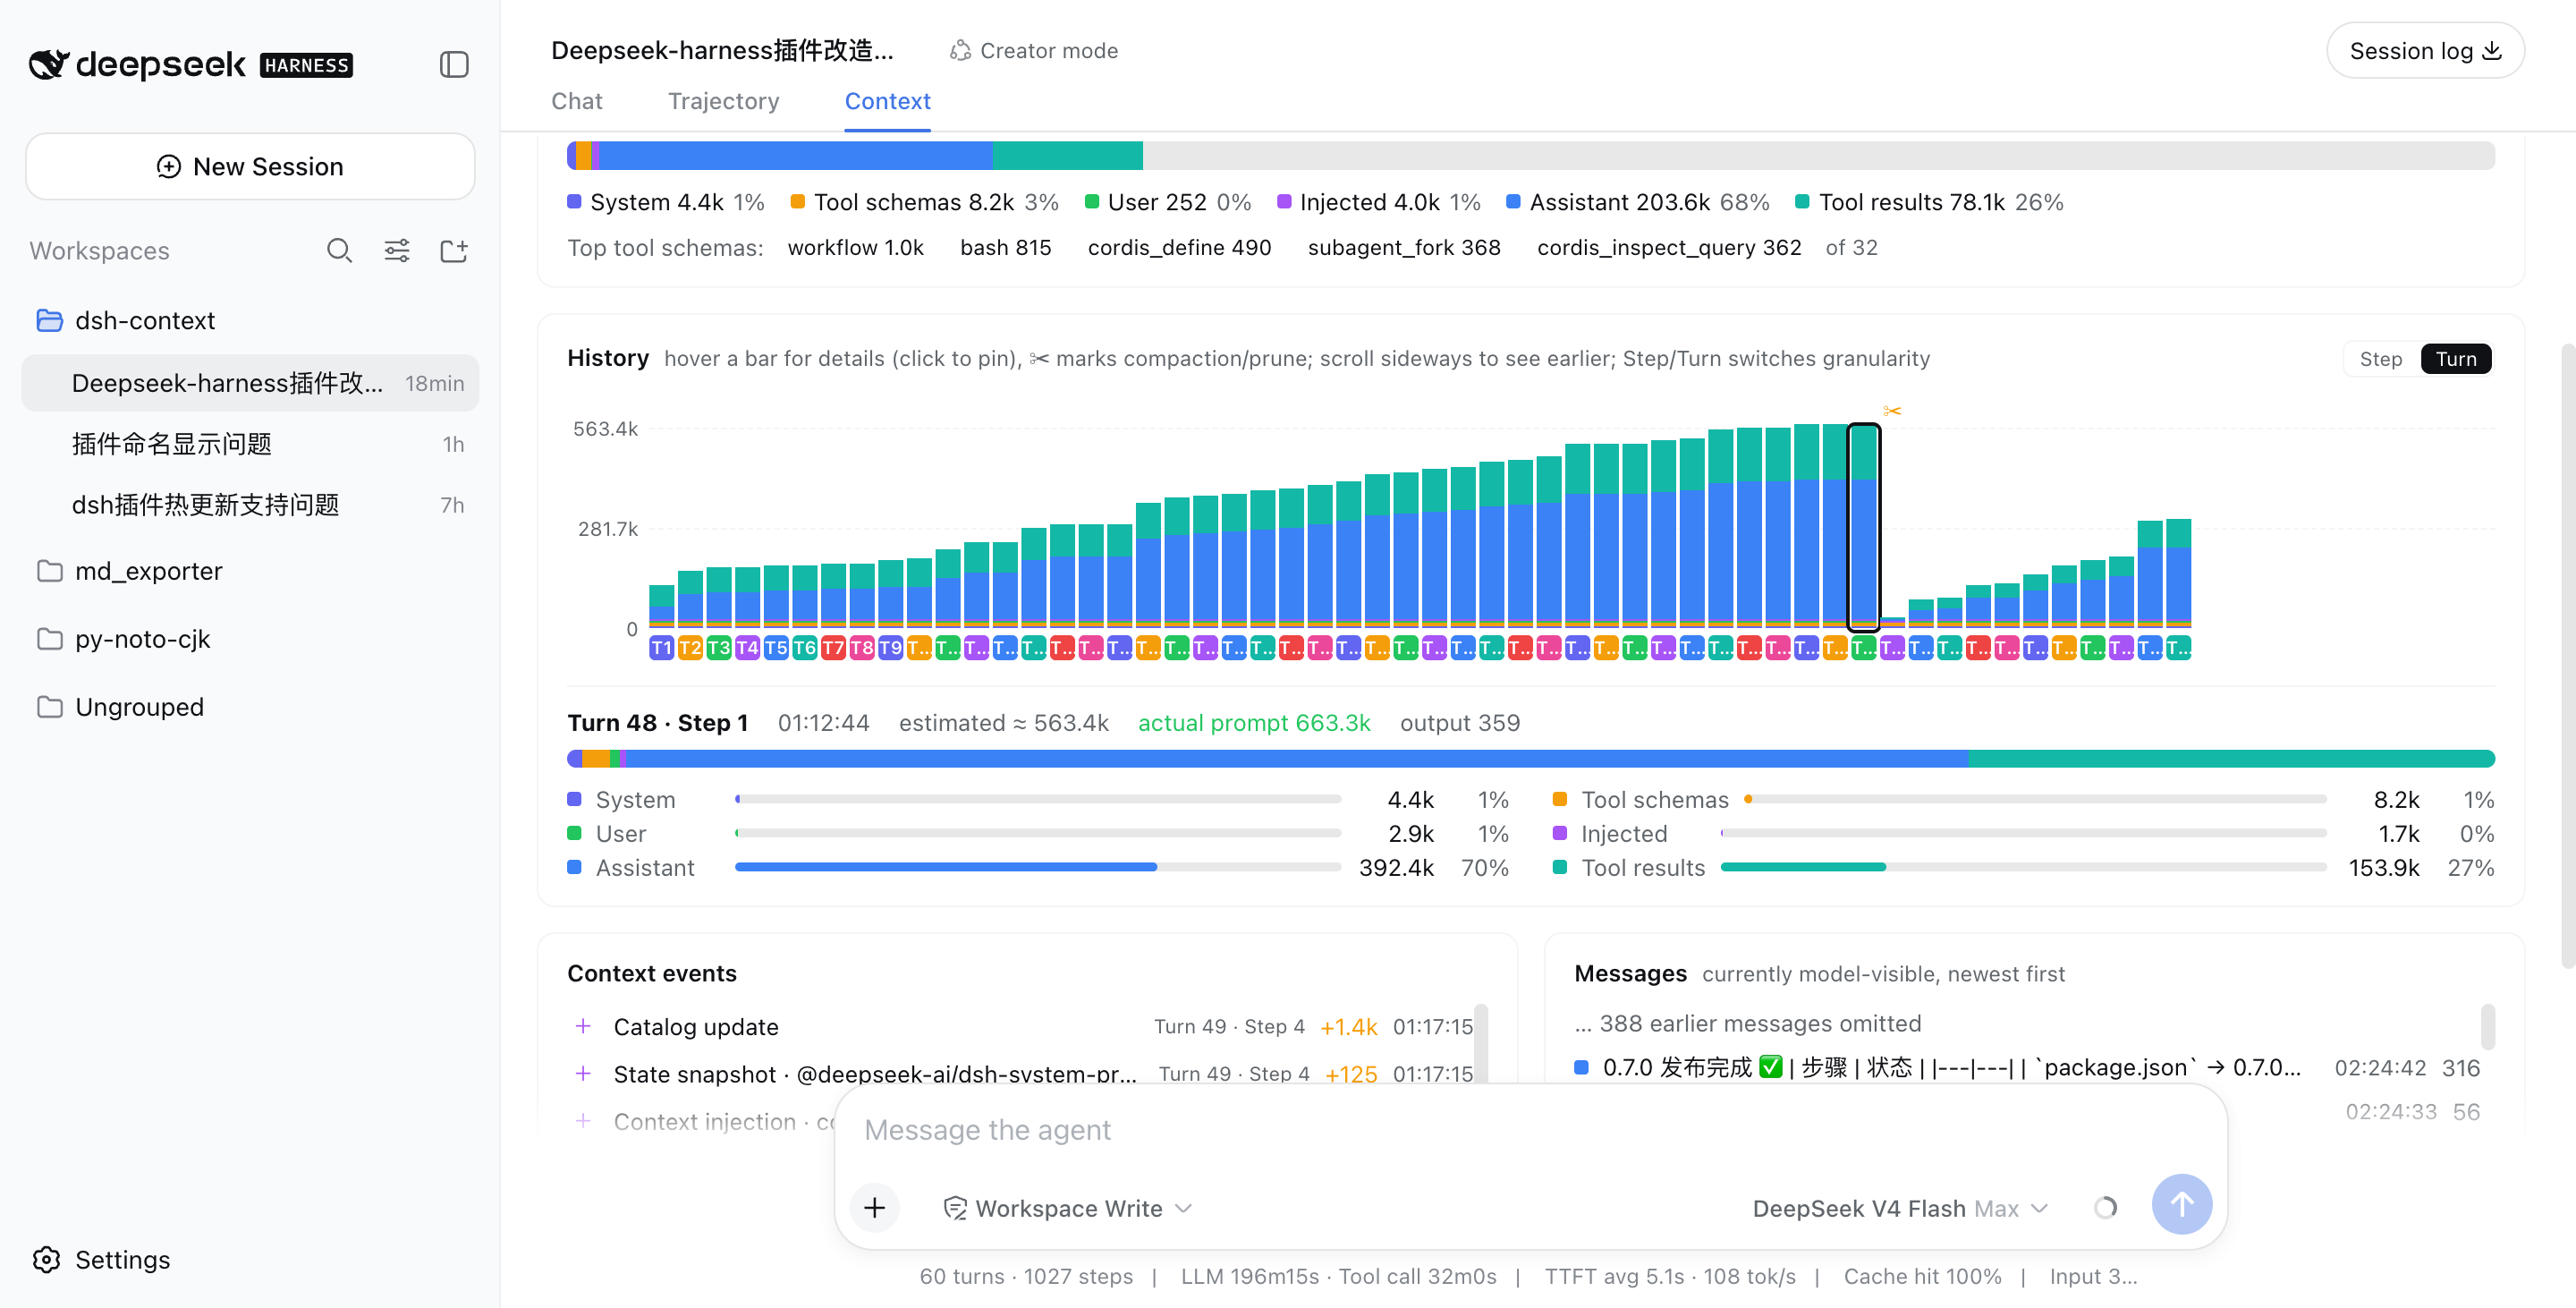
Above: a real session that grew to ~563k tokens across 48 turns, then compaction (✂) recycled −535.5k in one step, and the conversation continued from a fresh, small window.
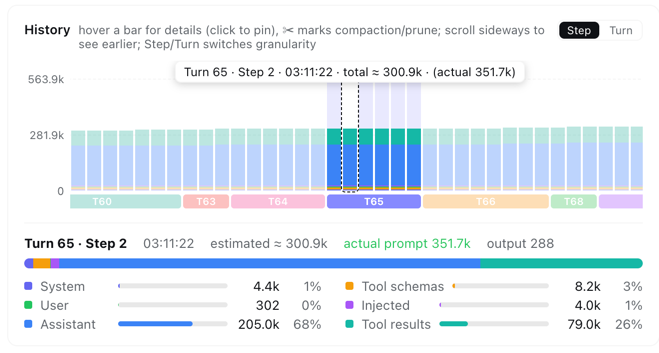
In Step granularity, hovering any bar shows that single step’s context info instantly — its turn/step, timestamp, and estimated vs. provider-reported token counts:
⚡ Context events — when and why the window changed
Every compaction, tool-output prune, skill or plugin context injection, and model switch — each with its token delta, turn/step attribution, and timestamp. Filter by category (Inject / Compact / Prune / Switch) to see exactly when each kind of event happened and its impact — e.g. when a skill was injected, when instructions were added, or how much a compaction reclaimed:
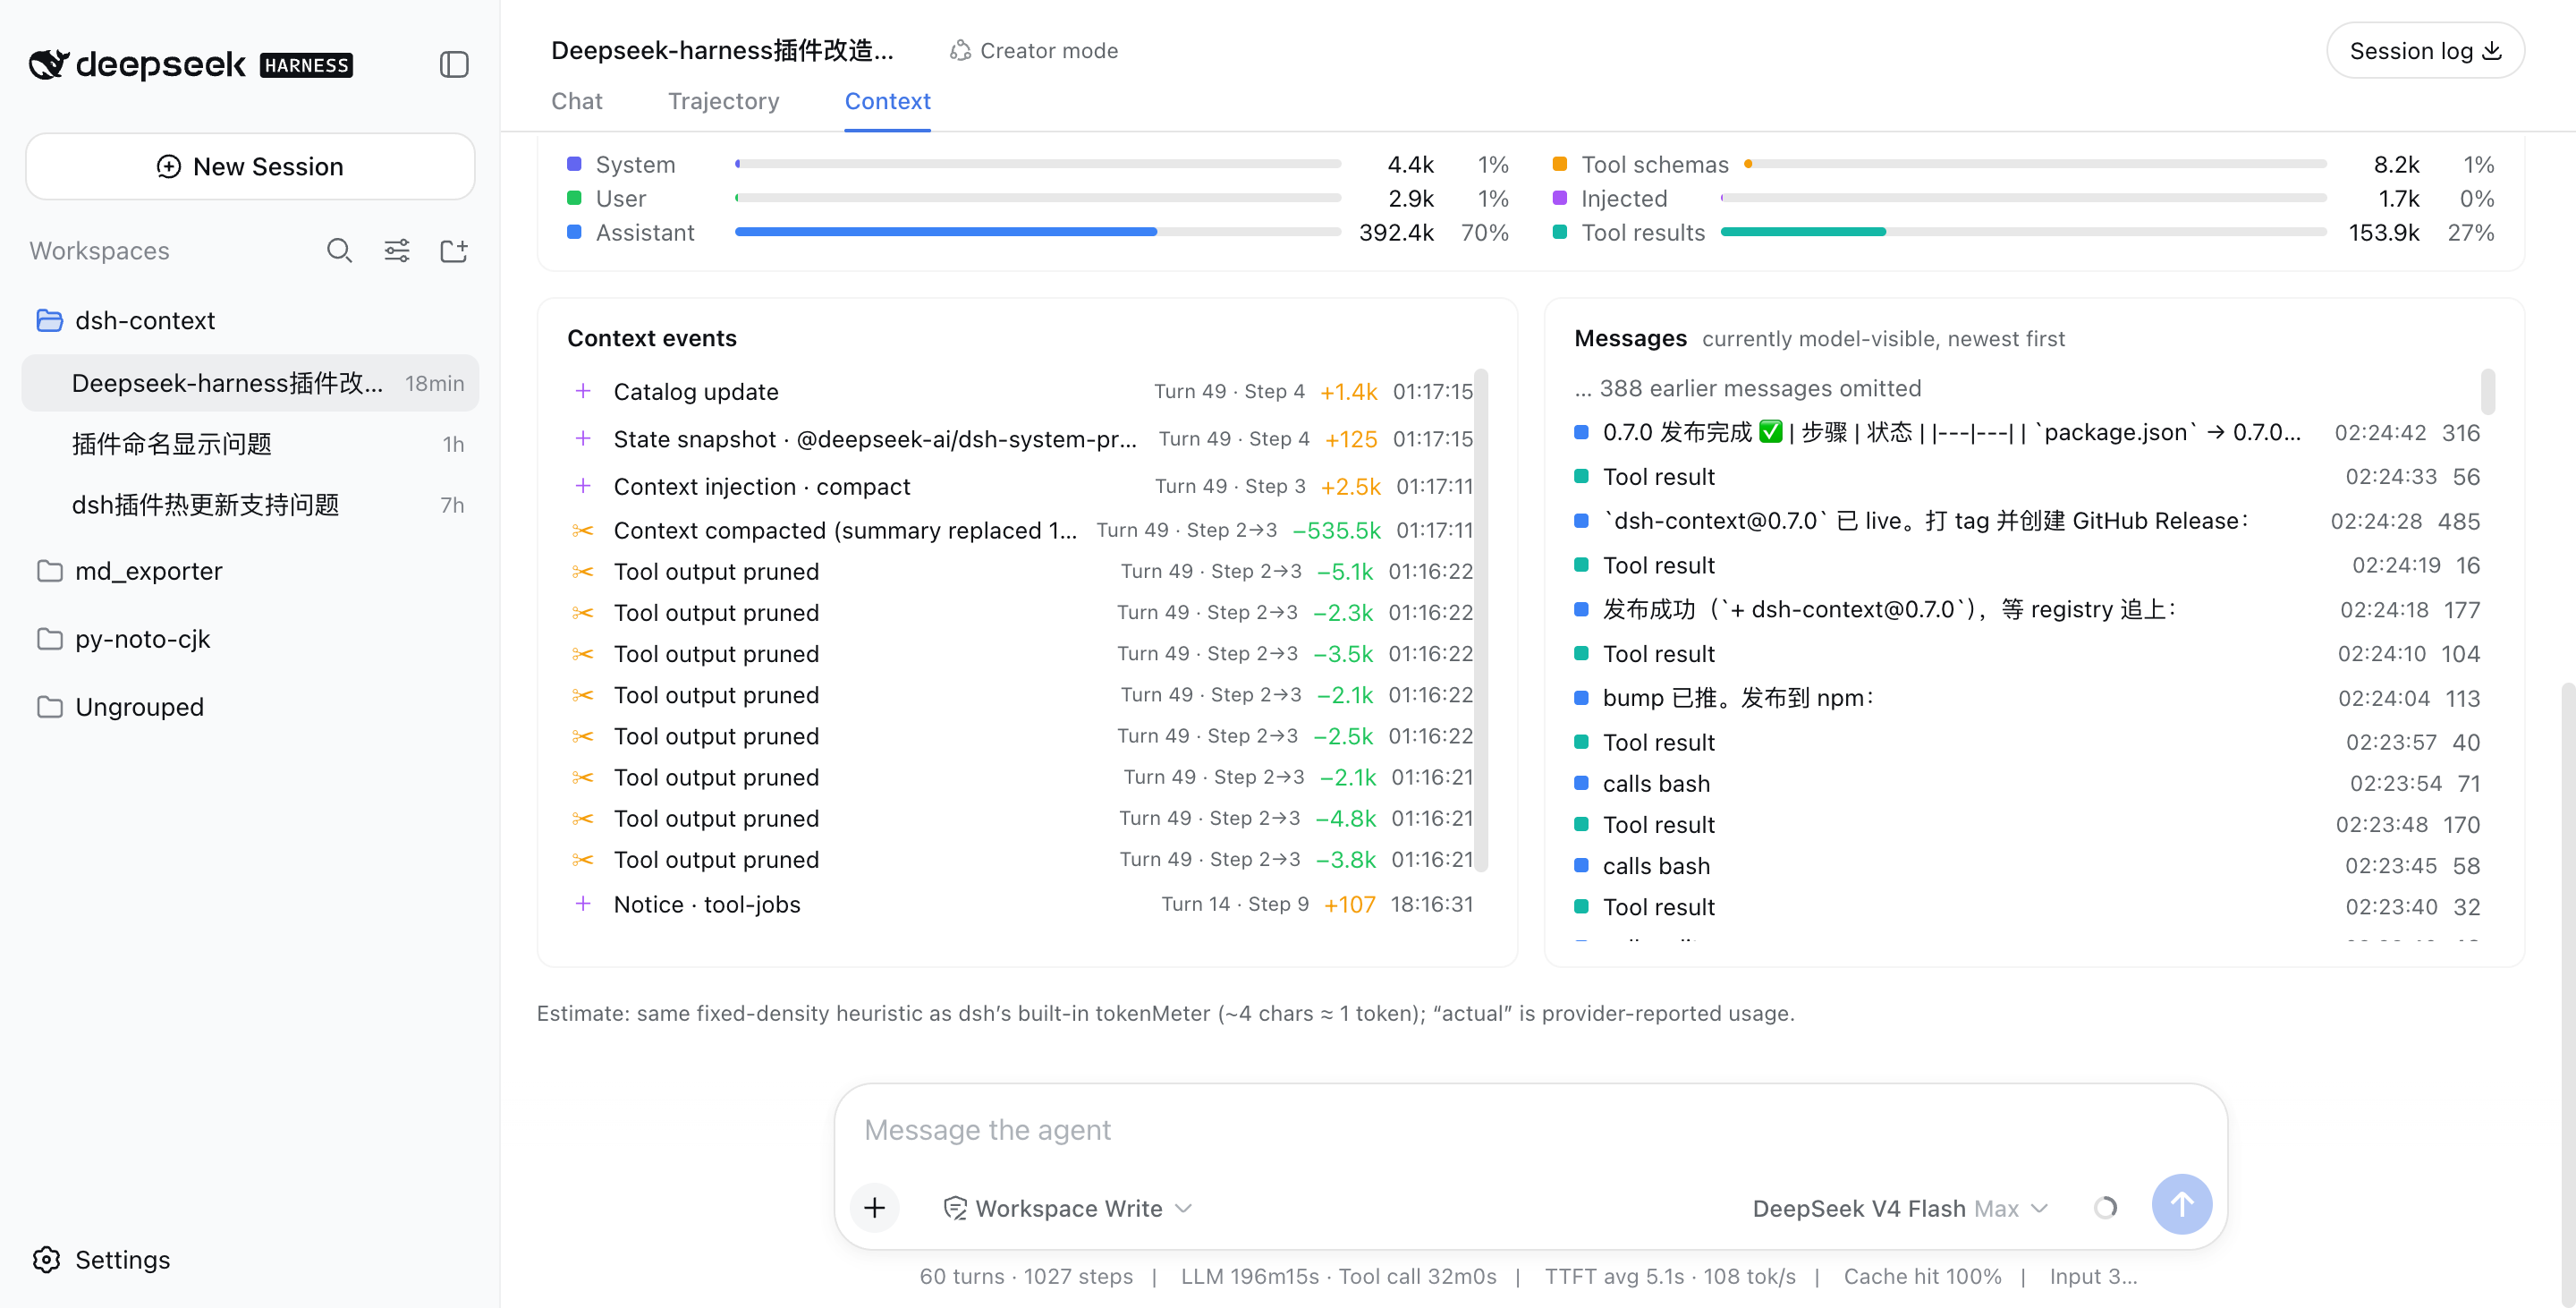
💬 Messages — the currently model-visible surface
The exact message list the model sees right now, newest first, with a per-message token cost.
🧭 Context browser — open the box of any request
Pick Live (next request) or any retained step from the picker, and browse what that request was actually assembled from:
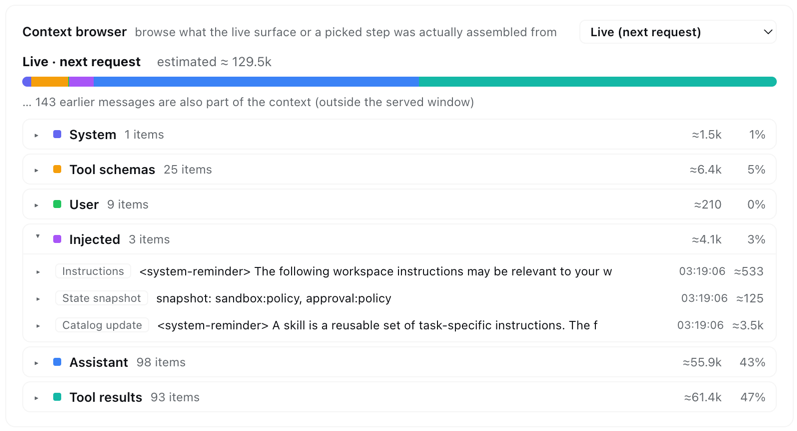
Six collapsible category sections (system prompt, tool schemas, user messages, injected context, assistant replies, tool results) expand into one row per element — each with its token price — and every element expands again into its actual content: the full system prompt, each tool’s description and JSON schema, message text, reasoning, tool-call arguments, and tool outputs.
- Linked with the history chart — hover any bar in the History card and the browser previews that step instantly; leave the chart and it returns to your own pick. Keep a category open while scrubbing to compare one category across steps.
- Honest about coverage — steps before a compaction are reconstructed from the removed-message archive, and the card says so when a step’s makeup is only approximate. Elements older than the loaded chat window page older history in automatically when you expand them, and live injections (AGENTS.md, session-start context, …) are always listed — never a token sum without its items.
Like it?
If dsh-context helped you understand what your agent is carrying around, a ⭐ on GitHub is much appreciated — and issues/PRs are welcome!
License
Frequently Asked QuestionsFAQ
Use the verified command dsh plugin --profile default add github:bowenliang123/dsh-context in a DSH-enabled shell. The command resolves the public package metadata and keeps the plugin attached to the catalog identity shown on this page.
Compatibility follows the bundle and profile status shown above. If a profile is not detected, keep the plugin disabled there and check the repository documentation before enabling it in production.
The GitHub link and activity metadata are the source of truth for releases and maintenance. Revisit this page after a new release to confirm the catalog has observed the latest version.