BrambleXu/dsh-annotate
Visual browser element annotation for DeepSeek Harness, capturing DOM, styles, accessibility data, comments, and viewport screenshots. DeepSeek Harness 浏览器元素标注插件,捕获 DOM、样式、可访问性数据、评论和视口截图。
Listed
6
Browser
Bundle verified
Preview
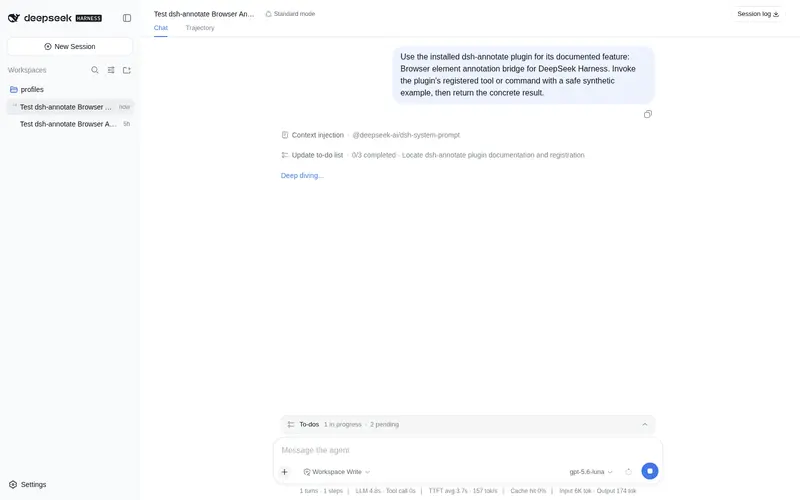
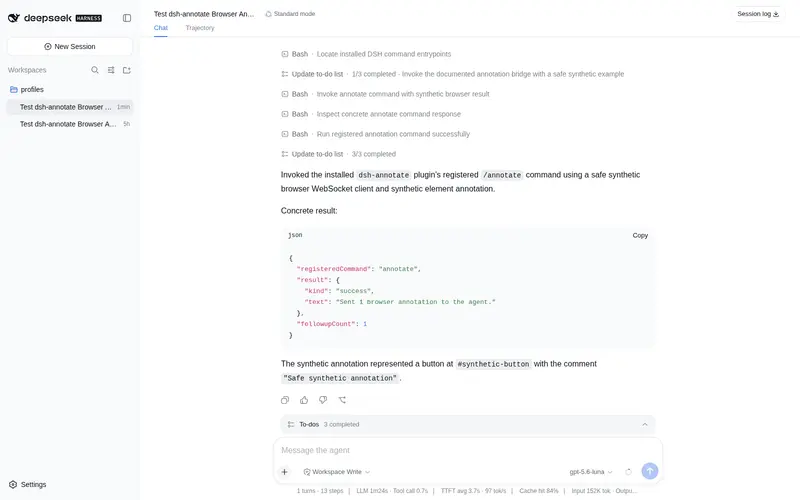
What it does
Select browser elements directly during Vibe Coding and send structured visual feedback to the DeepSeek Harness Agent.
Best for
- Frontend developers who want to attach feedback to exact browser elements during a Harness session.
- UI debugging workflows that need selectors, DOM facts, computed styles, accessibility data, comments, and viewport screenshots.
- Local Chrome or Chromium review sessions where structured annotations should return to the current Agent.
Not ideal for
- Remote-browser workflows or teams that cannot install the companion unpacked Chrome extension.
- Full-page capture, edit recording, or draggable inline-note workflows.
- Reviews spanning multiple browsers or tabs; version 0.1 targets one local browser and one active tab.
README
dsh-annotate






English | 中文
Visual browser feedback for DeepSeek Harness. /annotate asks the companion Chrome extension to enter selection mode; each selected element contributes a selector, DOM facts, computed style highlights, accessibility data, a comment, and an optional viewport screenshot to the agent’s next turn.
Why this exists 💡
Browser UI problems are difficult to describe precisely through plain text. dsh-annotate lets you point at the relevant element and send the Agent the surrounding browser facts, so visual feedback stays attached to the page element instead of becoming a vague description or a copied screenshot.
Features ✨
- Select elements directly in Chrome or Chromium through
/annotate. - Capture selectors, DOM facts, computed-style highlights, accessibility data, comments, and optional viewport screenshots.
- Send structured annotations to the Agent through a local loopback WebSocket bridge.
- Restrict browser connections by loopback host, extension origin, and optional extension ID.
Install 📦
Add the plugin project to a Harness profile:
dsh plugin --profile demo add ./dsh-annotate
Then install the companion extension:
- Open
chrome://extensionsin Chrome or Chromium. - Enable Developer mode.
- Choose Load unpacked and select this project’s
browser-extensiondirectory. - Open the extension popup and keep the default bridge endpoint.
For tighter local authorization, copy the extension ID shown in the popup into allowedExtensionId in a later Harness patch layer.
Use 🚀
/annotate
/annotate http://localhost:3000
Click an element, enter its comment, and repeat as needed. Submit sends all captured facts and the visible-tab screenshot to the agent. Escape cancels.
Configure ⚙️
- id: dsh-annotate
  name: dsh-annotate
  config:
    host: 127.0.0.1
    port: 43119
    allowedExtensionId: abcdefghijklmnopqrstuvwxyzabcdef
    requestTimeoutMs: 300000
    maxPayloadBytes: 16777216
    includeScreenshot: true
The server refuses non-loopback hosts and browser connections whose origin is not chrome-extension://. An empty allowedExtensionId accepts any locally installed Chrome extension; set the exact ID for stricter isolation.
Develop 🧑💻
pnpm install
pnpm run check
Reload the unpacked browser extension after editing its files.
Scope 🎯
Version 0.1 targets one local Chrome/Chromium browser, one active tab, and visible-viewport screenshots. Remote browsers, full-page capture, edit recording, and inline draggable note cards are deferred.
License 📄
MIT
Credits 🙏
The interaction is inspired by pi-annotate. This implementation is built around Harness’s human-command, attachment, and Agent APIs and uses a small loopback WebSocket bridge instead of a native-messaging host.
Frequently Asked QuestionsFAQ
Use the verified command dsh plugin --profile default add github:BrambleXu/dsh-annotate in a DSH-enabled shell. The command resolves the public package metadata and keeps the plugin attached to the catalog identity shown on this page.
Compatibility follows the bundle and profile status shown above. If a profile is not detected, keep the plugin disabled there and check the repository documentation before enabling it in production.
The GitHub link and activity metadata are the source of truth for releases and maintenance. Revisit this page after a new release to confirm the catalog has observed the latest version.