bowenliang123/dsh-context
Best DeepSeek Harness plugin for context insight and management, with context dashboard / browser and context command, for context statistics, composition, breakdown, evolution details, understanding how the context is made of, and how it evolves. 一站式 DeepSeek Harness 上下文可视化插件,Context 面板及浏览器与 Context 命令,透视上下文组成、演进、压缩、剪枝等事件与动作。
已收录
239
Usage
Bundle 已验证
预览
功能介绍
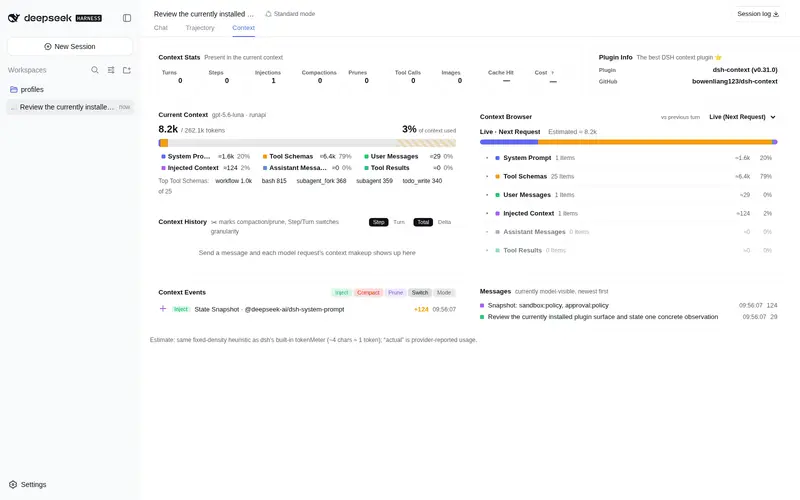
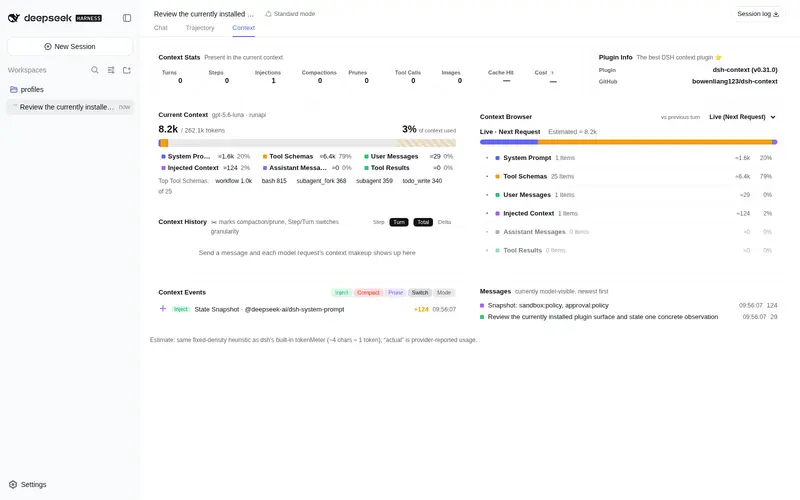
DSH 上下文洞察面板:Context 仪表盘 + /context命令 + Context 浏览器,查看 Context的分类组成、内容详情、演进趋势、压缩/注入事件、统计等一站式 Context 全生命周期管理。
适合
- 需要诊断系统提示、工具、消息、注入、回复和工具结果如何占用模型上下文窗口的 DSH 用户。
- 需要按请求查看 token 估算、上下文演进、压缩、剪枝、注入和模型切换历史的长会话工作流。
- 希望通过面板或 /context 命令检查下一次请求及历史步骤实际组装内容的用户。
不适合
- 无需排查上下文组成和生命周期事件的短会话。
- 要求精确重建每个压缩前步骤的场景;从已移除消息归档恢复的旧步骤可能只是近似结果。
- 希望直接改变模型行为,而不是查看和管理上下文可见性的用户。
README
dsh-context


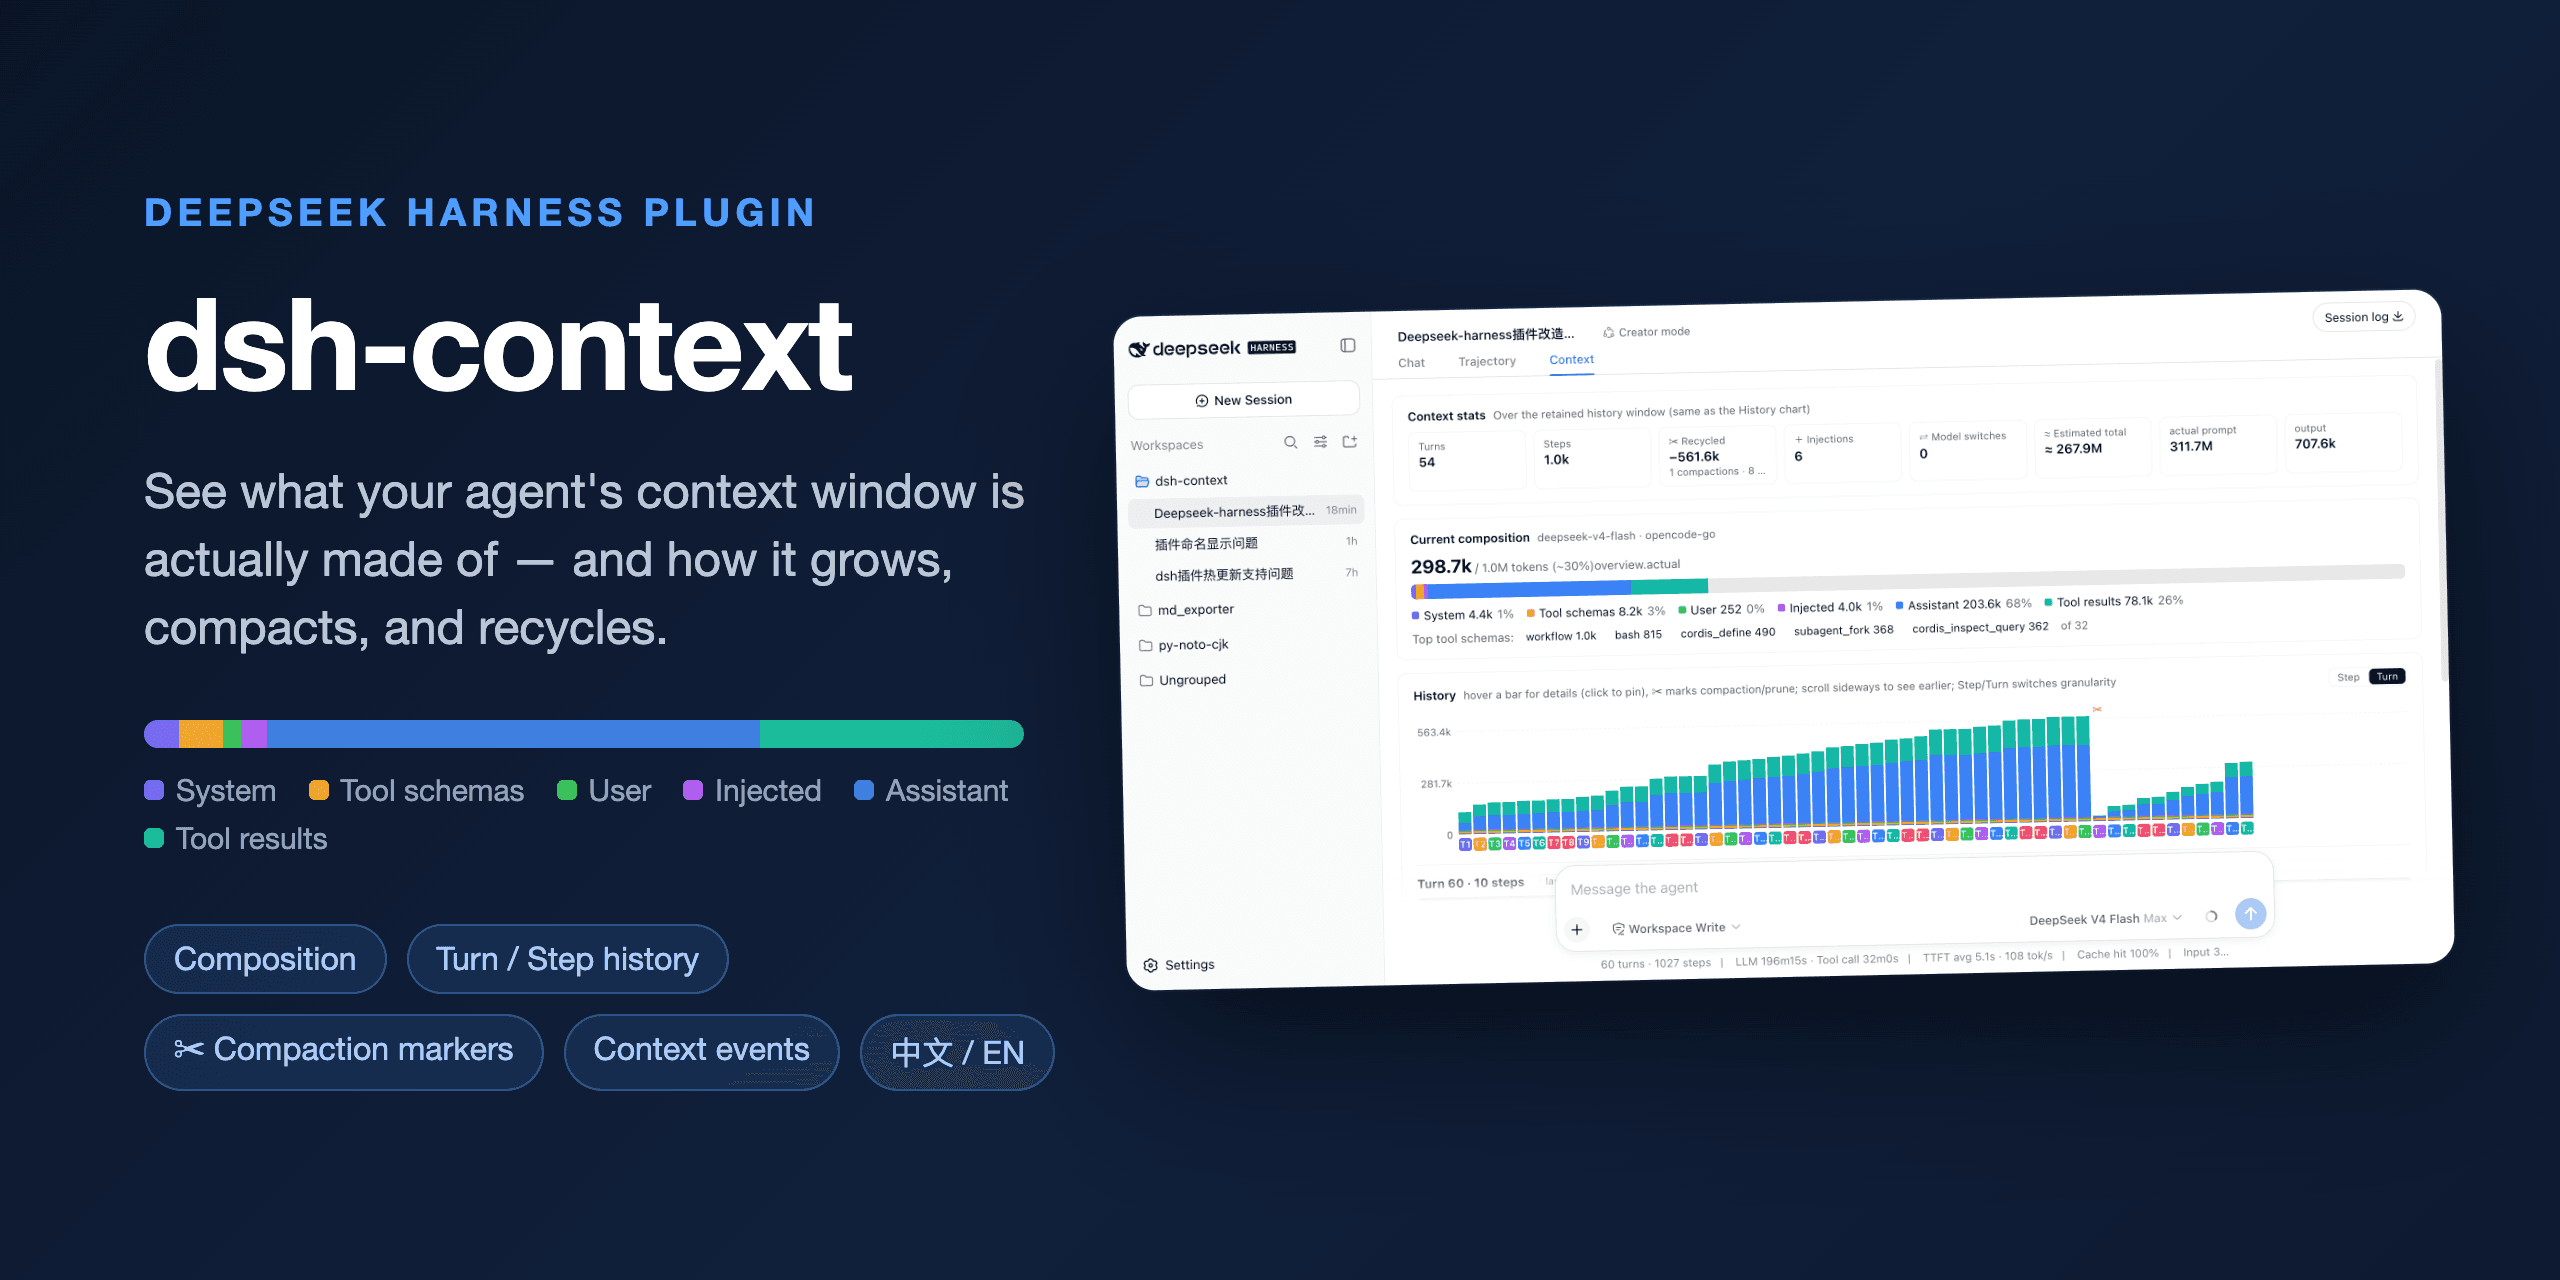
The best DeepSeek Harness plugin for Agent’s context insights and management.
dsh-context provides full context lifecycle management features.
- Context tab — an UI context dashboard for DeepSeek Harness’s context stats, composition, history, events, and messages.
-
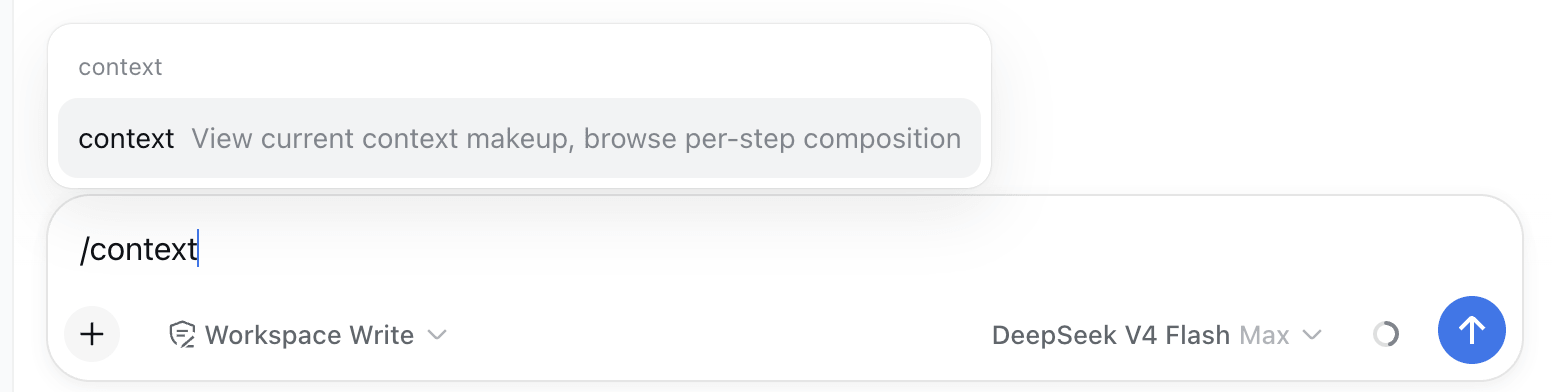
/contextcommand — the slash command shows the context model for current context composition and recent context evolution.
Install / Update
To Install from any DeepSeek Harness installation:
dsh plugin --profile web add dsh-context
Or to update the dsh-context plugin:
dsh plugin --profile web update dsh-context@latest
Then start the web UI with dsh web. No build step, no restart.
Use it
Context tab
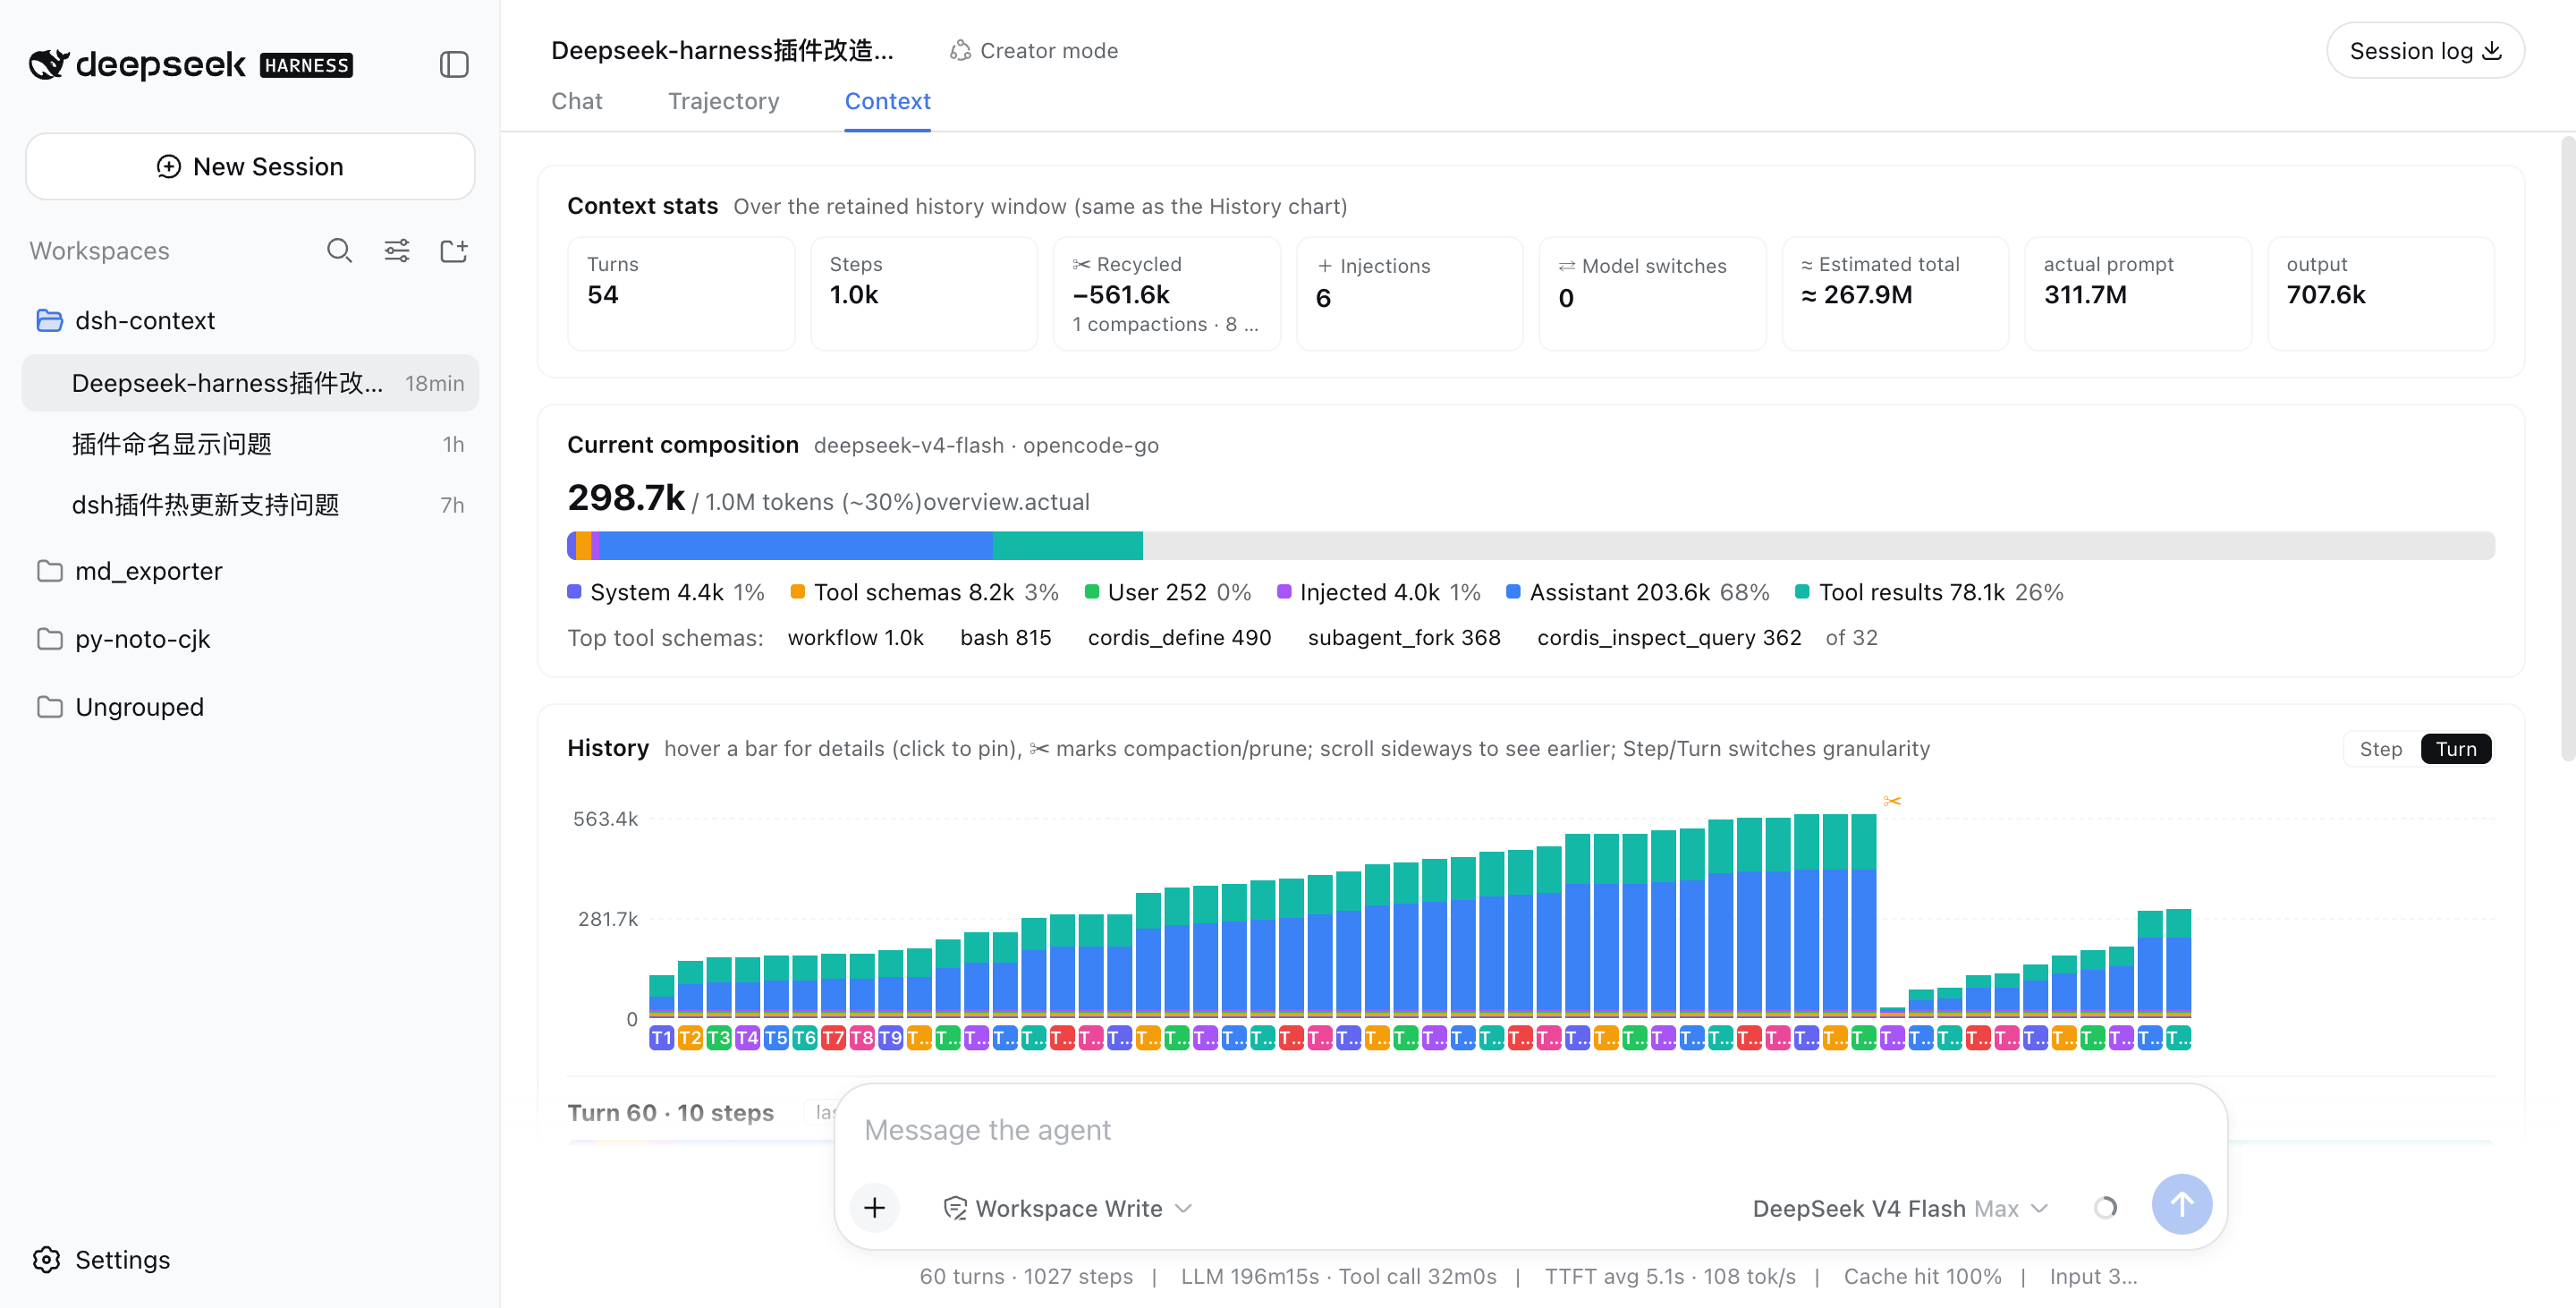
Open any session and click the Context / 上下文 tab:
⌨️ /context command — In-session Context Insight modal
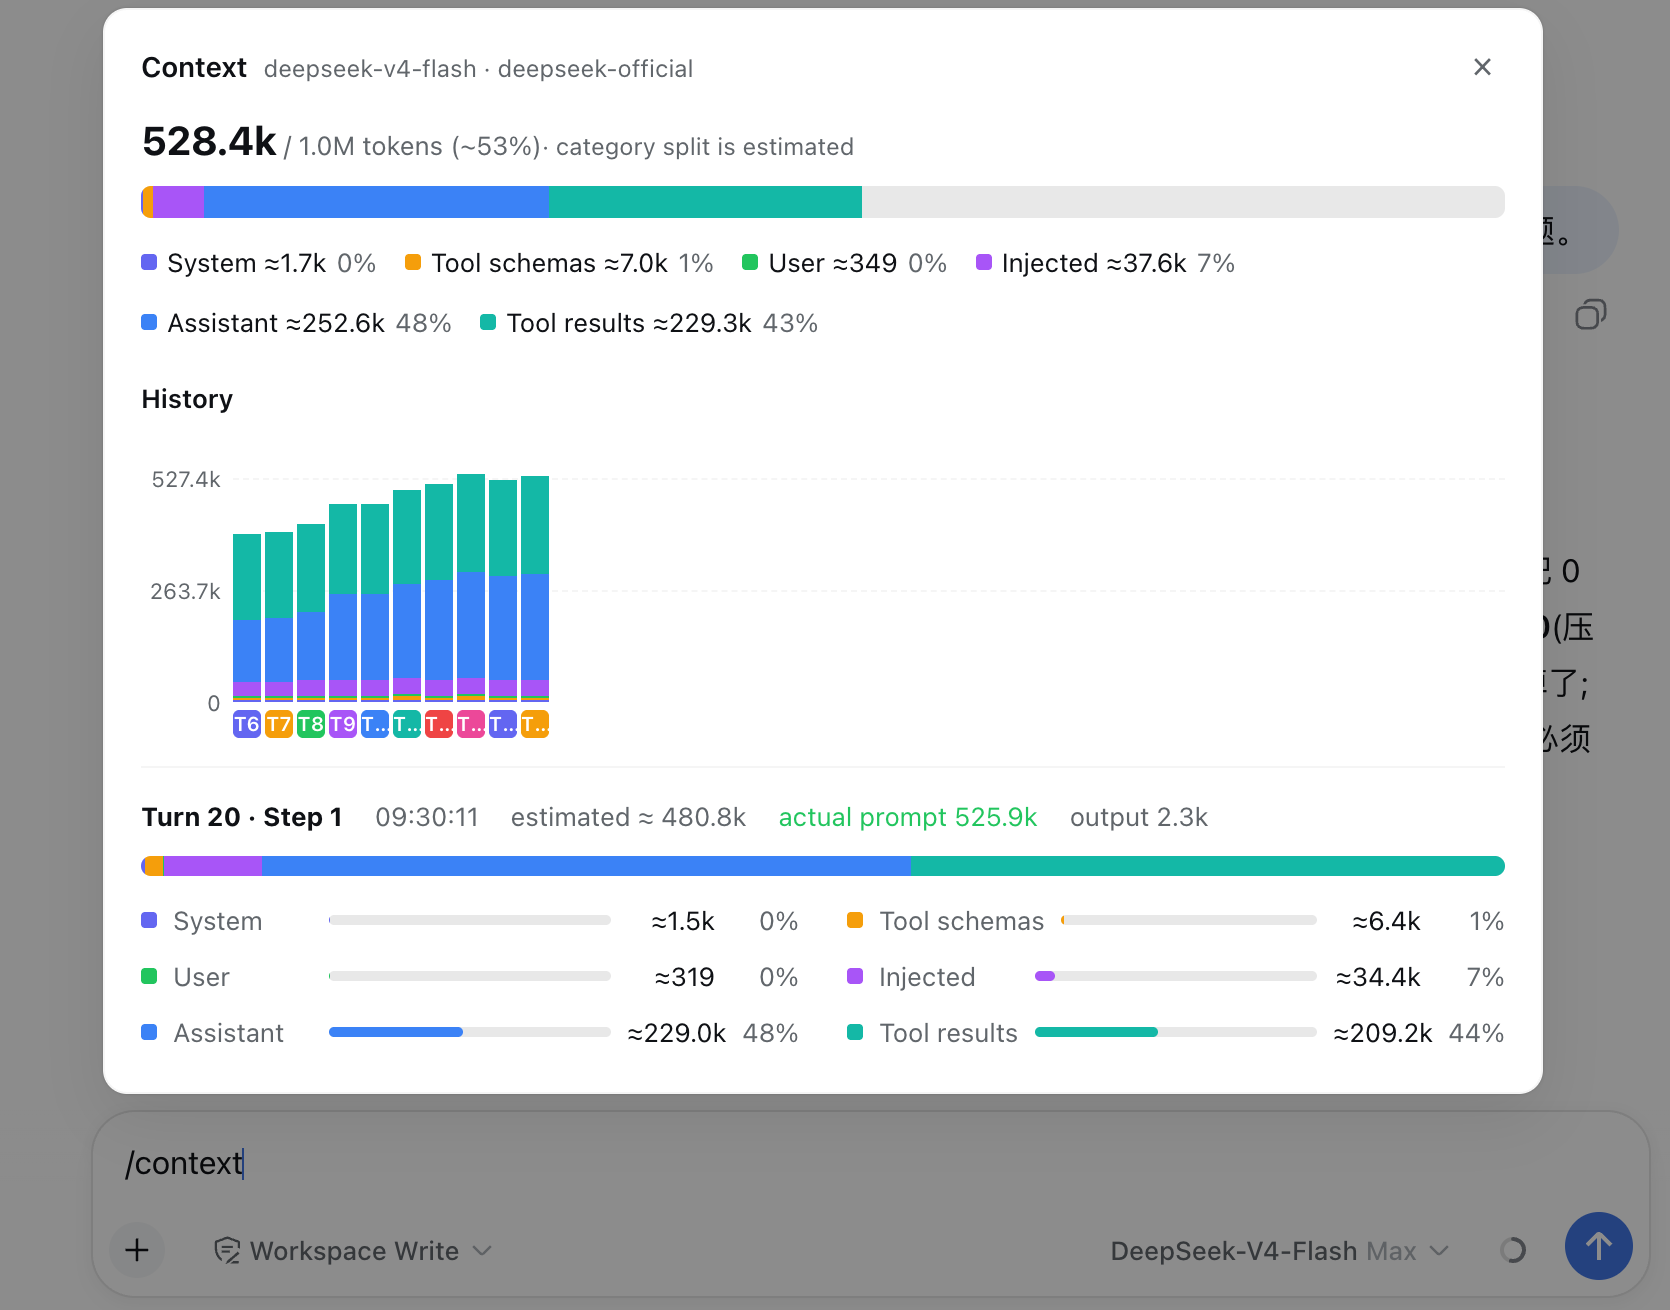
Type /context (or pick it from the / menu) and press Enter: a centered dialog shows the Current Composition card and the Context browser — the same composition bar, legend, and per-step browsing as the tab, so you can inspect what any request was assembled from without leaving the chat.
What you’ll see
📊 Context stats — the session at a glance
Turns, steps, how many injections, compactions, and prunes have happened.
🧱 Current composition — what’s in the window right now
A six-color stacked bar scaled against the model’s full context window (the gray track is your remaining headroom): system prompt, tool schemas, your messages, injected context, assistant replies, and tool results — plus the top-5 most expensive tool schemas. When a conversation starts degrading, this is where you find out which part ate the budget.
📈 History — watch the window grow (and get compacted)
One stacked bar per model request, finer than per-message. Toggle between Turn and Step granularity, scroll sideways through the session, hover any bar for a quick tooltip, and click to pin the full breakdown — including provider-reported actual prompt/output tokens next to the estimate. Hovering a bar also drives the Context browser beside it — the browser previews that step’s assembled context in real time as you scrub across the history. ✂ marks where compaction or pruning happened — watch the bars drop:
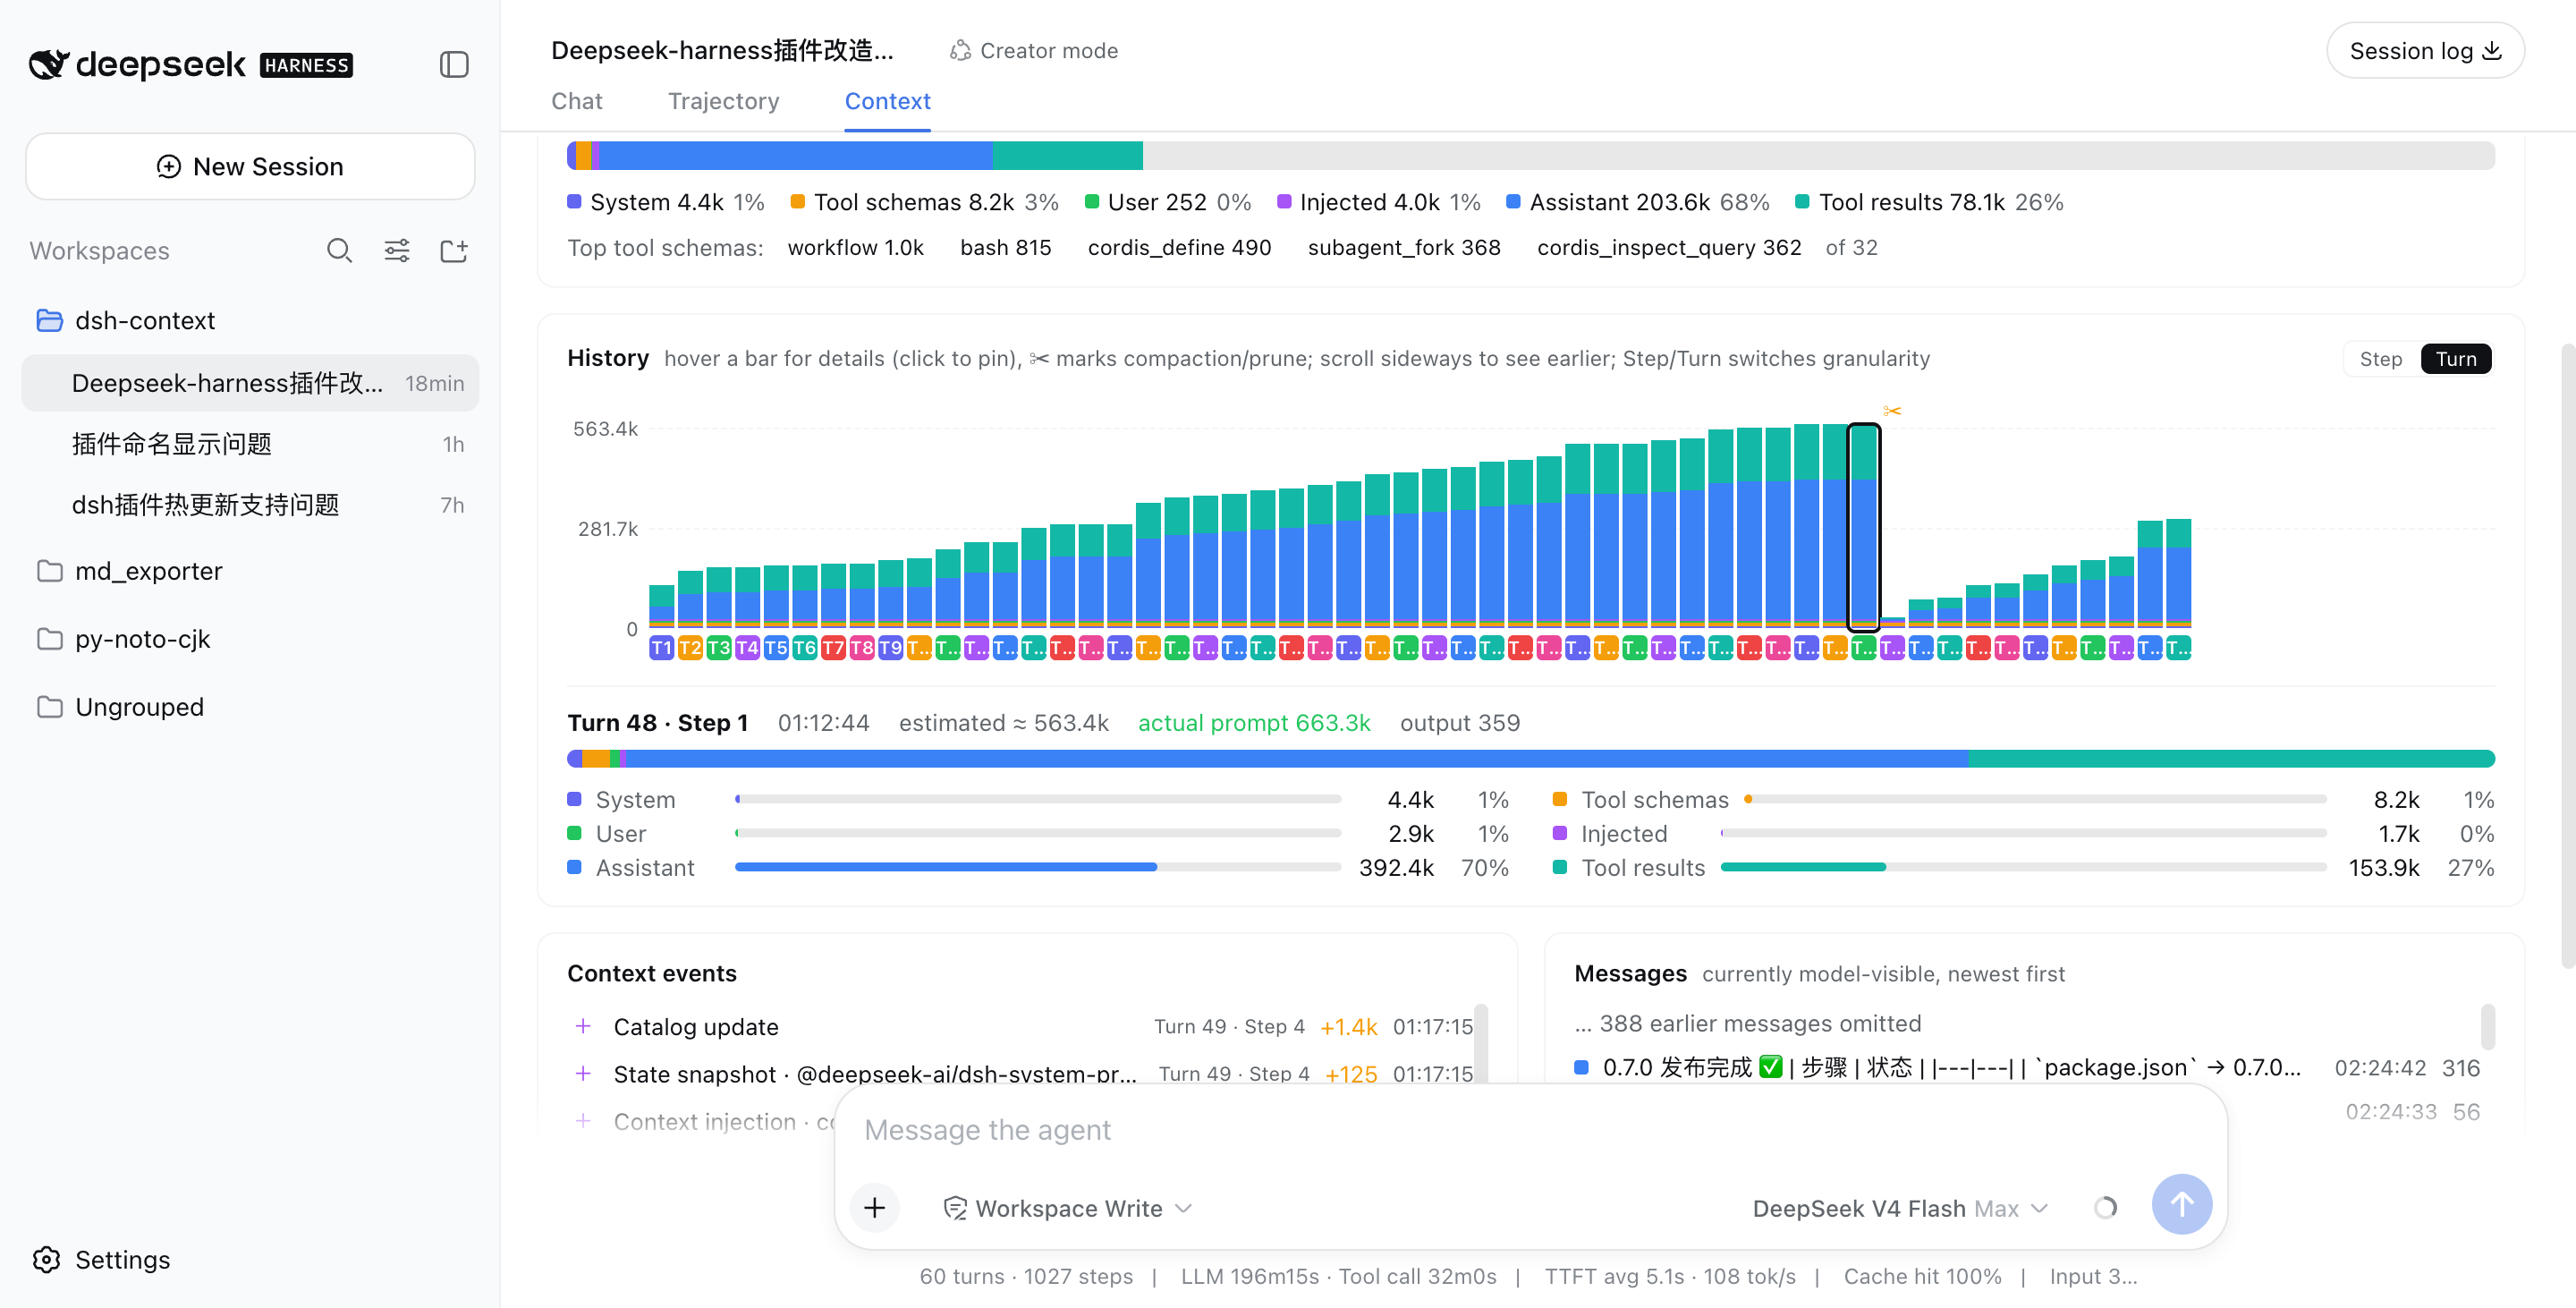
Above: a real session that grew to ~563k tokens across 48 turns, then compaction (✂) recycled −535.5k in one step, and the conversation continued from a fresh, small window.
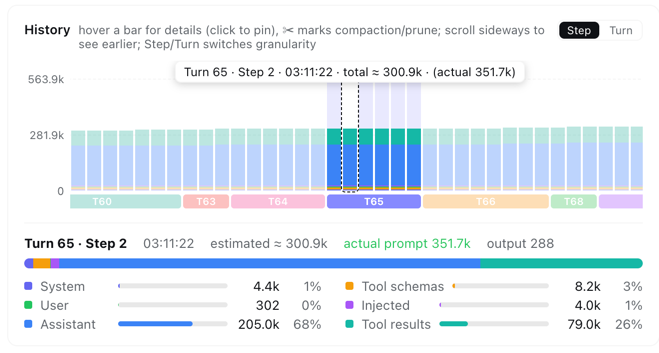
In Step granularity, hovering any bar shows that single step’s context info instantly — its turn/step, timestamp, and estimated vs. provider-reported token counts:
⚡ Context events — when and why the window changed
Every compaction, tool-output prune, skill or plugin context injection, and model switch — each with its token delta, turn/step attribution, and timestamp. Filter by category (Inject / Compact / Prune / Switch) to see exactly when each kind of event happened and its impact — e.g. when a skill was injected, when instructions were added, or how much a compaction reclaimed:
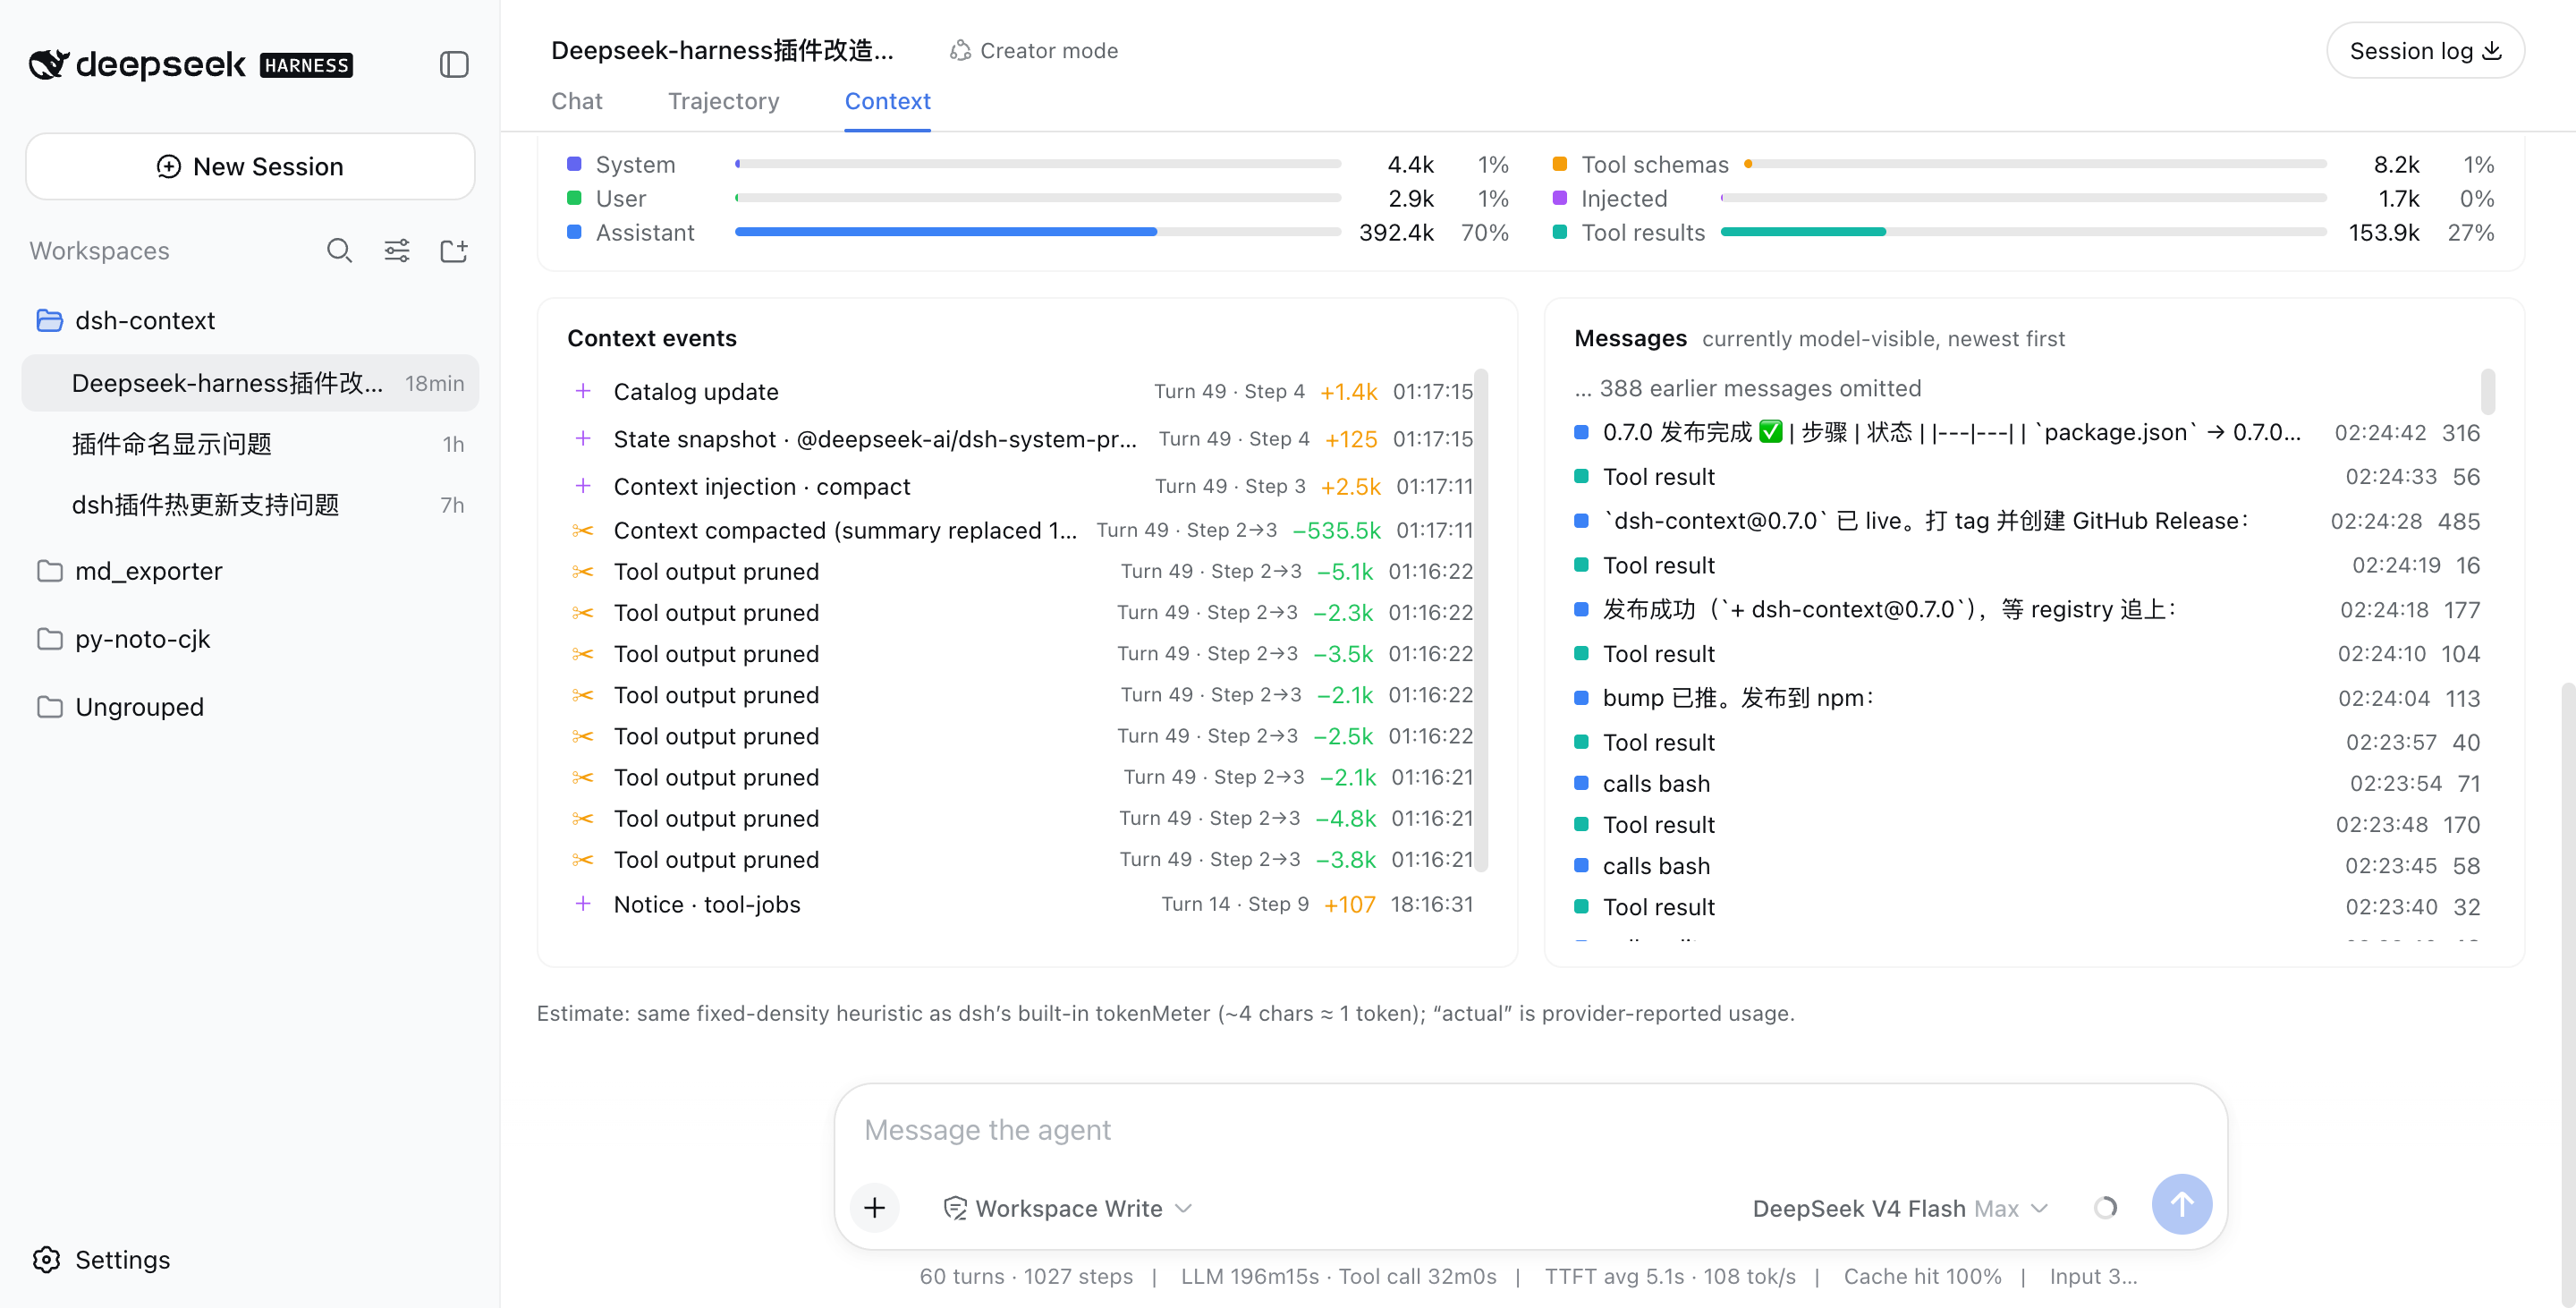
💬 Messages — the currently model-visible surface
The exact message list the model sees right now, newest first, with a per-message token cost.
🧭 Context browser — open the box of any request
Pick Live (next request) or any retained step from the picker, and browse what that request was actually assembled from:
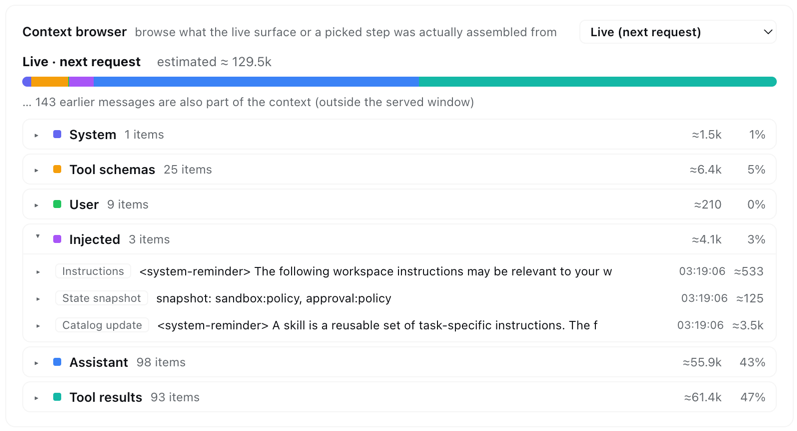
Six collapsible category sections (system prompt, tool schemas, user messages, injected context, assistant replies, tool results) expand into one row per element — each with its token price — and every element expands again into its actual content: the full system prompt, each tool’s description and JSON schema, message text, reasoning, tool-call arguments, and tool outputs.
- Linked with the history chart — hover any bar in the History card and the browser previews that step instantly; leave the chart and it returns to your own pick. Keep a category open while scrubbing to compare one category across steps.
- Honest about coverage — steps before a compaction are reconstructed from the removed-message archive, and the card says so when a step’s makeup is only approximate. Elements older than the loaded chat window page older history in automatically when you expand them, and live injections (AGENTS.md, session-start context, …) are always listed — never a token sum without its items.
Like it?
If dsh-context helped you understand what your agent is carrying around, a ⭐ on GitHub is much appreciated — and issues/PRs are welcome!
License
常见问题常见问题
在启用了 DSH 的终端中执行已验证命令 dsh plugin --profile default add github:bowenliang123/dsh-context。命令会解析公开 package 元数据,并保持插件与本页展示的目录身份一致。
兼容性以页面上展示的 bundle 与 profile 状态为准。如果某个 profile 尚未检测到,请先保持禁用,并在生产启用前阅读仓库文档。
GitHub 链接和 activity 元数据是 release 与维护状态的来源。新版本发布后重新查看本页,确认目录已经观察到最新版本。