Jannchie/dsh-bill
DSH (DeepSeek Harness) plugin: per-session cost line + cost attribution report, priced by llm-pricing
已收录
2
Usage
Bundle 已验证
预览
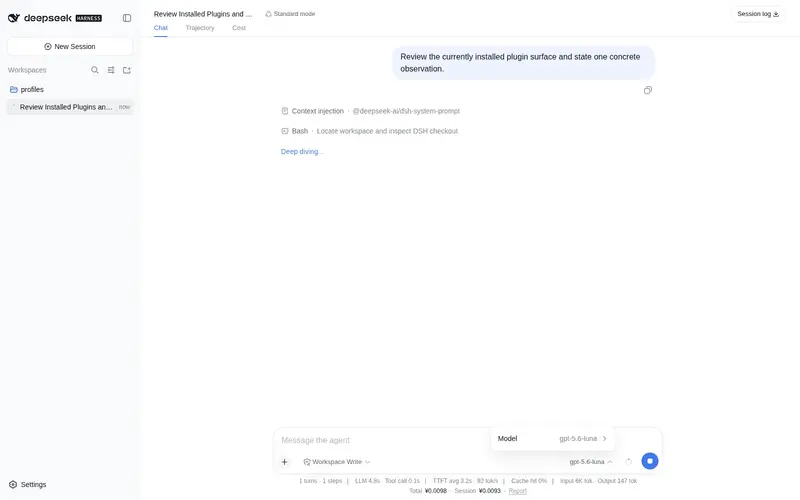
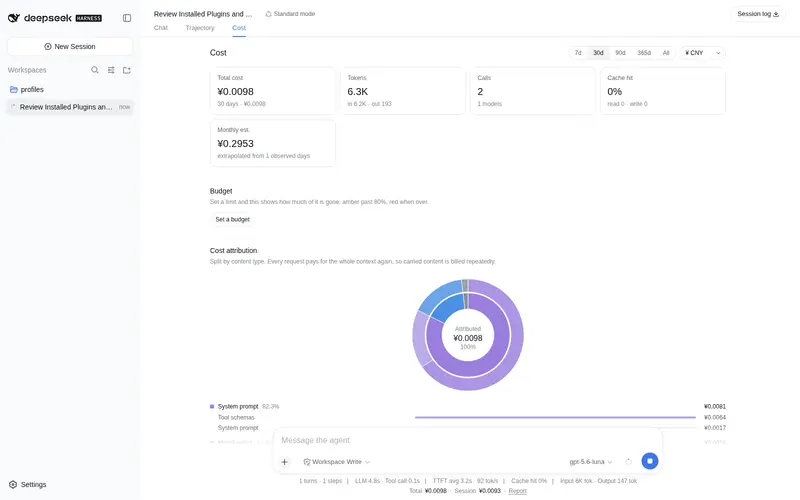
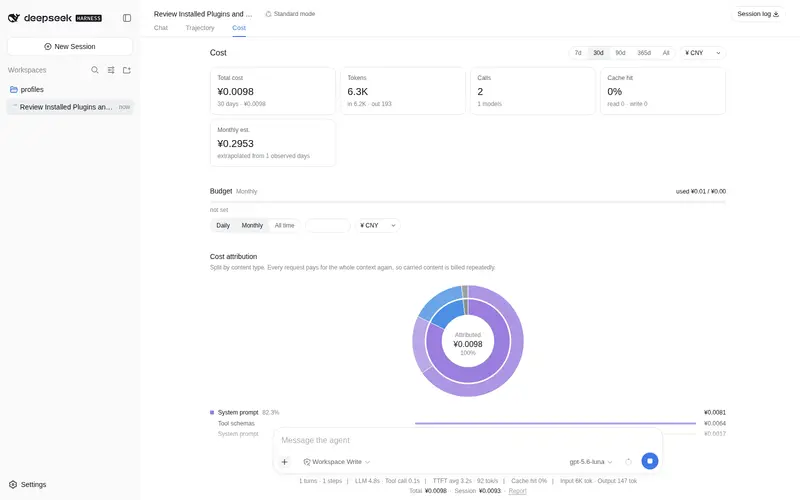
功能介绍
按在线价格目录计价的费用统计(models.dev + OpenRouter,8000+ 模型,每次调用按自身时刻定价):每轮成本行、把花费归因到工具输出 / 模型输出 / 系统提示词 / 终端命令的「费用」标签页、预算、月度预测、约 166 种实时汇率货币,以及 bill_stats agent 工具。
适合
- 需要逐轮费用、历史时点计价,并将成本归因到提示词、输出、工具和命令的团队。
- 需要管理模型预算、月度预测,或跨大量目录收录模型与币种核算费用的用户。
不适合
- 主要需要跟踪多家供应商订阅额度或余额的用户;文档中的余额支持仅限 DeepSeek。
- 无法访问在线价格目录和汇率端点的离线或严格隔离环境。
README
dsh-bill
| English | 中文 |
Cost tracking for DSH (DeepSeek Harness). A line under each turn tells you what that turn cost; the Cost tab tells you what the money went on.


Install
dsh plugin --profile web add dsh-bill
Restart dsh web to pick it up.
Features
-
Cost attribution — the bill split by kind of content: tool output, model output, system prompt, terminal commands (grouped by
git/pnpm/rg), tool input, attachments, system reminders, user input. The sunburst drills in. - Per-turn cost — one line under every finished turn: what it cost, how many steps, the cache-hit rate. It reads the session log itself, so turns from before you installed the plugin are covered too.
- Always on screen — a line under the shipped stats line (all-time, this session, peak share), and today’s spend against the budget in the sidebar. Each of the four surfaces can be turned off individually in settings.
- Report — a Cost tab in the conversation, beside Chat and Trajectory: total, tokens, cache hit, peak share, monthly forecast, account balance; broken down by model, by session, and by purpose (including loop overhead such as context compaction); a daily trend and a weekday × hour heatmap.
- Budget — a daily / monthly / all-time limit that turns amber past 80% and red when you go over.
- Multi-currency — live rates for ~166 currencies; each model’s base rate is shown in the currency its vendor prices it in.
-
Agent tool —
bill_stats, so the model can answer questions about spend directly. - English and Chinese follow the DSH language setting; history from before the install is backfilled from the session log.
How it differs from similar plugins
Three substantive differences:
No hand-maintained price table. Every other plugin ships a built-in table of 2–4 DeepSeek models, which means no prices at all once you switch provider — and which is why they all need a “edit the price table by hand” entry point. dsh-bill pulls models.dev and OpenRouter through llm-pricing, covering 8000+ entries, so a new model is priced the day it ships.
Price is a timeline, not a number. The others compute a cost and store it (or recompute at today’s price), so history goes wrong the moment a vendor changes its rates or a call crosses a peak/off-peak boundary. dsh-bill prices each call at that call’s own instant, and never recomputes history.
It answers “on what”. The others answer only “how much” — they consume the provider’s aggregate token counts and never look at the request content. dsh-bill splits the request into classified segments at capture time and apportions cost by position in the cache prefix.
They do some things better: usage-stats reads balances and subscription quotas from 11 providers (dsh-bill only does DeepSeek), cost-meter can read OpenCode Go’s subscription quota, and both surface more always-on entry points than dsh-bill does.
常见问题常见问题
在启用了 DSH 的终端中执行已验证命令 dsh plugin --profile default add github:Jannchie/dsh-bill。命令会解析公开 package 元数据,并保持插件与本页展示的目录身份一致。
兼容性以页面上展示的 bundle 与 profile 状态为准。如果某个 profile 尚未检测到,请先保持禁用,并在生产启用前阅读仓库文档。
GitHub 链接和 activity 元数据是 release 与维护状态的来源。新版本发布后重新查看本页,确认目录已经观察到最新版本。