stuarthu/dsh-chrome
DeepSeek Harness (dsh) browser companion: Chrome side panel embedding the full dsh web UI + host plugins for page reading, HTTP capture, and browser control.
已收录
0
Browser
Bundle 已验证
预览
功能介绍
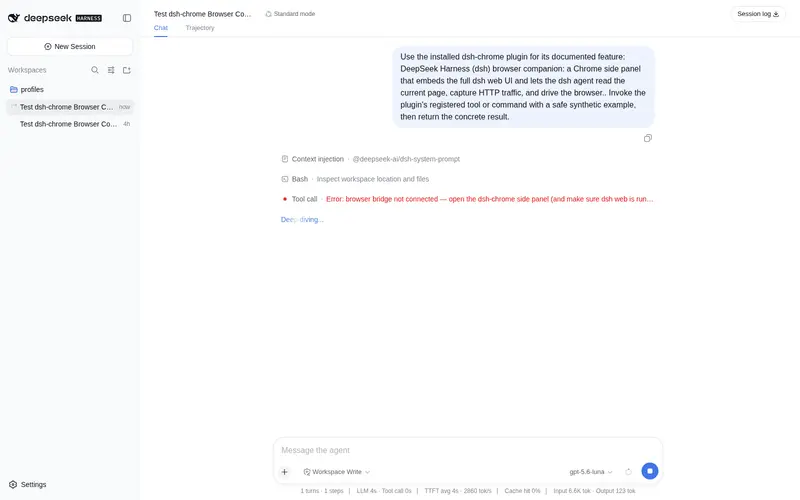
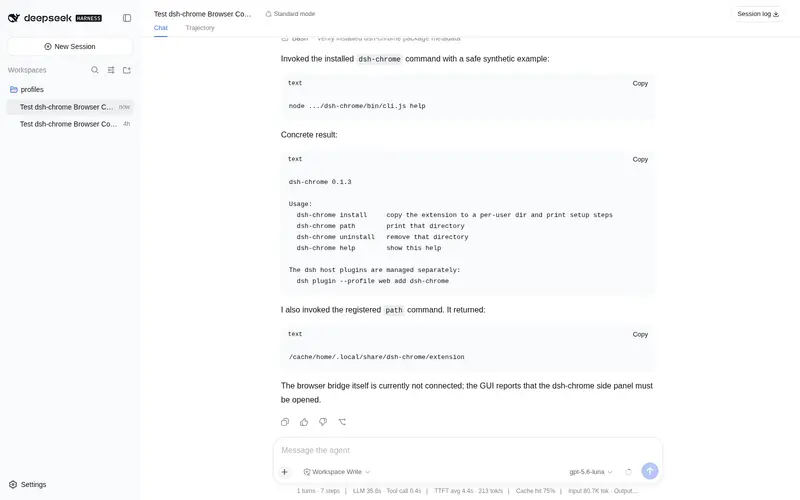
Chrome 侧边栏内嵌 dsh 网页界面,让 agent 读取当前页面、捕获 HTTP 流量并操作浏览器。
适合
- 希望在当前浏览页面旁使用完整 DSH Web 界面的 Chrome 用户。
- 需要 Agent 自动接收当前 HTTP(S) 页面文本的浏览器辅助研究或支持工作流。
- 需要按需抓取 HTTP 流量、点击页面、导航及新建标签页的 Web 调试和重复操作工作流。
不适合
- 非 Chrome 环境、低于 Chrome 118 的版本,或无法访问本地 dsh web 实例的配置。
- 无法接受本地 Agent 获得页面读取、流量抓取和浏览器控制权限的敏感或非受信浏览场景。
- 需要操作 chrome://、file://、扩展页面或 Chrome Web Store,却未按要求启用远程调试配置的工作流。
README
dsh-chrome — DeepSeek Harness browser companion
| English | 中文 |
A Chrome side panel that embeds the full dsh web UI (sessions, settings, approvals, tasks, goals, workspaces — everything) and lets the dsh agent perceive and drive your browser:
-
Sees the current page automatically. After you switch tabs or navigate
(SPA routes included), the “current page” (URL, title, body text, capped at
1,000,000 characters) is injected into your most recently active session, so
the agent knows what you are looking at. Only
http(s)tabs are injected this way. -
Reads HTTP traffic on request. When you ask it to, the agent starts a
capture (
browser_start_capture) and records the active tab’s request method, URL, status, request body and response body via the Chrome DevTools Protocol;browser_capture_requestsreads them back. Secret-shaped values are masked by default — see Security. -
Drives the browser.
browser_navigate/browser_click/browser_open_tab. -
Approval-free, with tool-level intent unlock. State-changing actions run
only when the current turn was started by a real message from you that
contains explicit browser intent. The words that unlock
browser_navigate/browser_click/browser_open_tabare open, navigate, click, visit, tab (打开 / 跳转 / 前往 / 点击 / 导航 / 访问 / 浏览一下 / 新标签), plus “go to” when it is followed by a page or URL (go to github.com,go to the page— a barego to the next stepdoes not unlock anything); the words that unlockbrowser_start_captureare capture, debug (抓包 / 抓一下 / 抓取请求 / 监听网络 / 网络请求 / 流量). Note that 抓取 on its own does not unlock capture — it reads as ordinary “fetch/scrape” intent; say 抓包 or 抓取请求. If an action is blocked you get a refusal quoting the exact words that would unlock that tool, so you can simply restate. An instruction hidden inside a web page cannot drive the browser (best-effort protection in approval-free mode, not an absolute guarantee). - While capturing, Chrome shows a “debugging this browser” banner (it disappears when capture stops).
Prerequisites
-
dsh webrunning locally (defaulthttp://127.0.0.1:3080; configurable in the extension’s settings). - Chrome 118+ (the extension relies on
InjectionResult.error, added in Chrome 118).
Install
Two halves: the host plugins (added to dsh) and the Chrome extension (loaded unpacked).
1. Add the host plugins to your dsh web profile:
dsh plugin --profile web add dsh-chrome
This registers the bridge, the browser tools, and the page injector. dsh hot-applies new plugin rows, so just refresh the browser afterwards — no restart needed unless you later edit an already-loaded plugin file.
2. Install the Chrome extension files and load them:
npx dsh-chrome install
This copies the extension to a stable per-user directory (prints the path) and shows the remaining steps:
- Open
chrome://extensions, turn on Developer mode. - Click Load unpacked and select the printed directory.
- Click the dsh-chrome toolbar icon to open the side panel.
Re-run npx dsh-chrome install after upgrading the package, then reload
the extension at chrome://extensions — the installer copies the files, so
without both steps Chrome keeps running the previous version against the new
host plugins. npx dsh-chrome path prints the directory.
To remove dsh-chrome completely, undo both halves: npx dsh-chrome uninstall
deletes the extension directory (then remove it in chrome://extensions), and
dsh plugin --profile web remove dsh-chrome unwires the host plugins.
Usage
- The side panel is the full dsh web UI — use it normally.
- Top bar: bridge status (warns if dsh is not running), Stop capture (manual override), Settings (change the dsh address).
- Tell the agent things like “open the xx page”, “click the login button”, “capture this page’s requests”.
Security
Trusted, local use only. The bridge and browser tools give a local dsh agent the ability to read pages, capture traffic, and drive your browser.
-
Capture is opt-in per tab and only sees requests made after it starts.
Two things to be aware of about its scope: stopping a capture stops
recording but keeps what was already recorded until the tab closes, and the
buffer is not scoped to the dsh session that started it — reading it back
(
browser_capture_requests) is not intent-gated, so any session talking to the same browser can read it. Only starting a capture requires your explicit instruction. HTTP headers are not captured (so Cookie / Set-Cookie / Authorization headers never reach the model). The remaining credential surface — secret-shaped URL query parameters (?access_token=…), request bodies (form/JSON logins) and tokens embedded in response bodies — is masked as«redacted»by default. To capture raw, unmasked traffic (e.g. for your own debugging), setredactCredentials: falseon thedsh-chrome-browser-toolsrow in your profile’scordis.patch.yml.- Redaction is best-effort, not a guarantee: it matches secrets by common key names, so a secret under an unusual key, or in a URL path or an unparseable/truncated body, can still pass through. Treat captured traffic as sensitive, and only enable capture on sites you trust.
- It does, however, fail closed on shape: if the extension and the host
disagree about the reply format (e.g. you upgraded the package but didn’t
re-run
npx dsh-chrome install), unrecognised fields are dropped rather than forwarded unmasked, and an unrecognisable reply raises an error.
- Injected “current page” messages are labelled untrusted data, and the agent is instructed never to execute instructions found inside them. The intent-unlock gate further prevents page content from triggering state-changing browser actions. These are best-effort defenses under an approval-free model, not hard guarantees — do not point the agent at untrusted or sensitive sites while capture is on.
Layout
| Path | Contents |
|---|---|
extension/ |
Chrome MV3 extension (side panel + service worker + options page) |
host/ |
Three dsh host plugins: bridge.js (WS bridge), browser-tools.js (agent tools + redaction), page-injector.js
|
host/redact.js |
Credential redaction for captured traffic |
host/intent-gate.js |
Intent-unlock keywords + turn-text extraction (shared with tools/verify-intent.cjs) |
cordis.patch.yml |
Bundle patch that mounts the three host plugins |
bin/cli.js |
dsh-chrome installer for the extension files |
docs/bridge-protocol.md |
Wire protocol between the extension and dsh |
tools/ |
Dev-only diagnostics over dsh session logs (verify-intent.cjs, dump-session.cjs, shared session-log.cjs); not shipped to npm |
Notes & limits
- Browser tools that read or manipulate page state (capture included) act on
the active tab only;
browser_list_tabsandbrowser_open_tabare the natural exceptions. - Capture retains a rolling last 500 entries; each request/response body and
the automatically injected page body are capped at 1,000,000 characters.
browser_get_page— the on-demand read — is a separate, smaller limit: ~40,000 characters of visible text and up to 400 links. - Page-change detection: tab switch / main-frame navigation / SPA route change
(
history.pushStateandreplaceState), ~2 s debounce; scrolling does not trigger it. Only the active tab’s navigations count — a background tab churning through SPA routes pushes nothing. The current page is also re-sent whenever the bridge reconnects. -
browser_clicknever retries. If the click’s result is lost — the page navigated away, or the injection/CDP call was cut off — the tool reports that it could not confirm whether the click took effect, rather than clicking again (clicking is not idempotent), and tells the agent to re-read the page withbrowser_get_pageto see what happened. - Page pushes are deduplicated: a navigation whose URL and body length match the previous push sends nothing. The bridge reconnecting always re-sends, since dsh drops its cached page when the connection closes.
- The extension’s own side-panel UI is currently Chinese only (the top-bar labels: bridge status, “stop capture”, settings). The embedded dsh web UI follows dsh’s own locale; only this thin extension chrome is not yet translated. Planned for a future release.
-
Reading and clicking pages Chrome won’t let extensions script —
chrome-extension://(another extension’s options page),chrome://,file://, and the Chrome Web Store. The worker decides this from the tab’s URL before trying, and routes those pages to the browser’s remote debugging protocol (http://127.0.0.1:9222) instead. This requires the browser to be launched with--remote-debugging-port=9222(and--remote-allow-origins=chrome-extension://<this-extension-id>if the remote endpoint enforces the Origin check). If the CDP endpoint is missing or unreachable, reading such a page fails with an explicit error naming the flag — it is not silently empty. Ordinaryhttp(s)pages never take this path, even when injection fails on them, and automatic “current page” injection covers only ordinaryhttp(s)tabs (the Web Store included in the exclusions).
License
MIT © Stuart Hu
常见问题常见问题
在启用了 DSH 的终端中执行已验证命令 dsh plugin --profile default add github:stuarthu/dsh-chrome。命令会解析公开 package 元数据,并保持插件与本页展示的目录身份一致。
兼容性以页面上展示的 bundle 与 profile 状态为准。如果某个 profile 尚未检测到,请先保持禁用,并在生产启用前阅读仓库文档。
GitHub 链接和 activity 元数据是 release 与维护状态的来源。新版本发布后重新查看本页,确认目录已经观察到最新版本。